[root@lizhipeng01 ~]# w
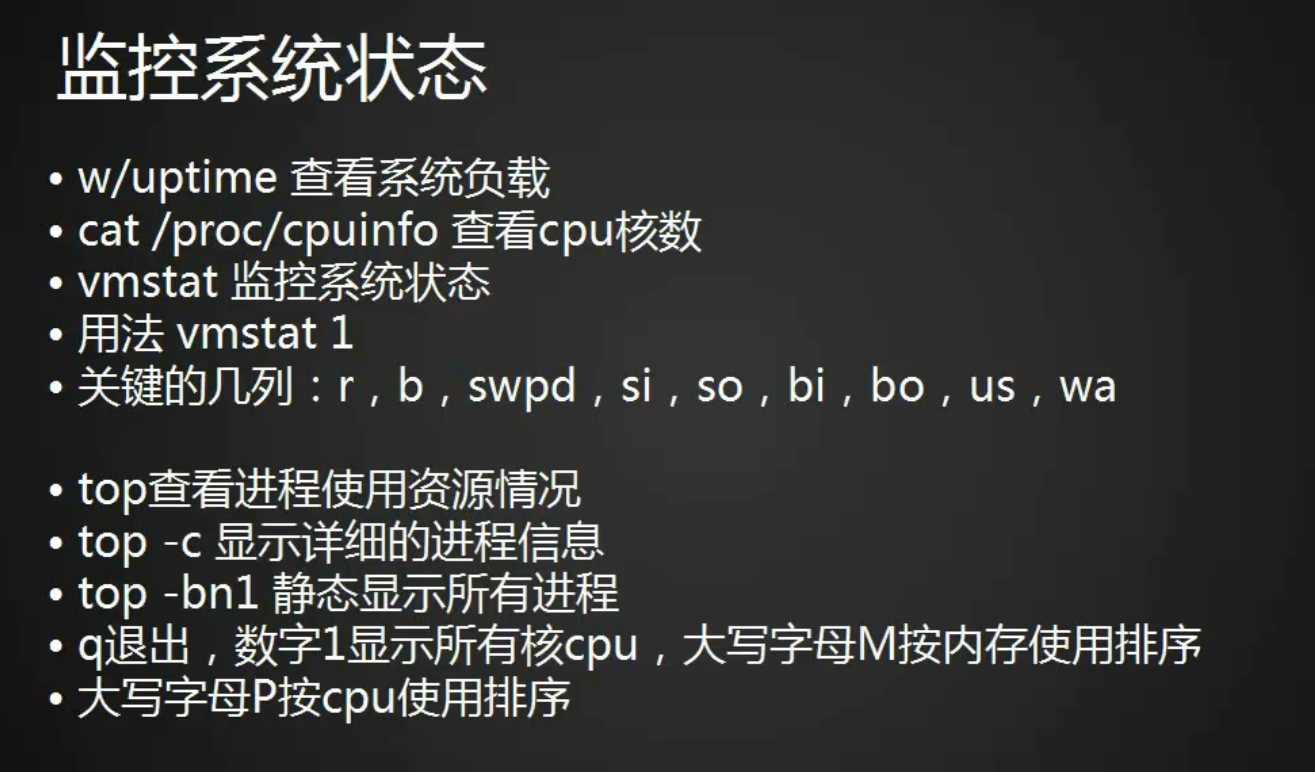
17:43:46 up 6 min, 1 user, load average: 0.00, 0.04, 0.05 负载,1分钟,5分钟,15分钟;单位时间内使用CPU活动的进程有几个
USER TTY FROM LOGIN@ IDLE JCPU PCPU WHAT
root pts/0 192.168.5.1 17:38 2.00s 0.04s 0.01s w
[root@lizhipeng01 ~]# date
2018年 01月 21日 星期日 17:43:53 CST
[root@lizhipeng01 ~]# cat /proc/cpuinfo
processor : 0 1颗逻辑CPU,最大是8,也就是数字为7
vendor_id : GenuineIntel
cpu family : 6
model : 94
model name : Intel(R) Core(TM) i5-6300HQ CPU @ 2.30GHz
stepping : 3
microcode : 0x74
cpu MHz : 2303.998
cache size : 6144 KB
physical id : 0
siblings : 1
core id : 0
cpu cores : 1
apicid : 0
initial apicid : 0
fpu : yes
fpu_exception : yes
cpuid level : 22
wp : yes
flags : fpu vme de pse tsc msr pae mce cx8 apic sep mtrr pge mca cmov pat pse36 clflush dts mmx fxsr sse sse2 ss syscall nx pdpe1gb rdtscp lm constant_tsc arch_perfmon pebs bts nopl xtopology tsc_reliable nonstop_tsc aperfmperf eagerfpu pni pclmulqdq ssse3 fma cx16 pcid sse4_1 sse4_2 x2apic movbe popcnt tsc_deadline_timer aes xsave avx f16c rdrand hypervisor lahf_lm abm 3dnowprefetch ida arat epb xsaveopt pln pts dtherm fsgsbase tsc_adjust bmi1 hle avx2 smep bmi2 invpcid rtm rdseed adx smap
bogomips : 4607.99
clflush size : 64
cache_alignment : 64
address sizes : 42 bits physical, 48 bits virtual
power management:
[root@lizhipeng01 ~]# uptime 第一行结果和w结果一样
17:54:47 up 17 min, 1 user, load average: 0.01, 0.02, 0.05
[root@lizhipeng01 ~]# w
17:54:56 up 17 min, 1 user, load average: 0.01, 0.02, 0.05
USER TTY FROM LOGIN@ IDLE JCPU PCPU WHAT
root pts/0 192.168.5.1 17:38 0.00s 0.04s 0.00s w
[root@lizhipeng01 ~]# vmstat
procs -----------memory---------- ---swap-- -----io---- -system-- ------cpu-----
r b swpd free buff cache si so bi bo in cs us sy id wa st
2 0 0 737316 764 139500 0 0 82 8 40 80 0 1 98 1 0
[root@lizhipeng01 ~]# vmstat 1 1表示每一秒显示一次
procs -----------memory---------- ---swap-- -----io---- -system-- ------cpu-----
r b swpd free buff cache si so bi bo in cs us sy id wa st
2 0 0 737500 764 139516 0 0 80 8 40 79 0 1 98 1 0
0 0 0 737484 764 139516 0 0 0 0 19 23 0 0 100 0 0
0 0 0 737484 764 139516 0 0 0 0 16 12 0 0 100 0 0
0 0 0 737484 764 139516 0 0 0 0 17 15 0 1 99 0 0
0 0 0 737484 764 139516 0 0 0 0 18 16 0 0 100 0 0
0 0 0 737484 764 139516 0 0 0 0 20 25 0 0 100 0 0
0 0 0 737484 764 139516 0 0 0 0 16 13 0 0 100 0 0
[root@lizhipeng01 ~]# vmstat 1 5 每一秒显示一次,显示5次
procs -----------memory---------- ---swap-- -----io---- -system-- ------cpu-----
r b swpd free buff cache si so bi bo in cs us sy id wa st r表示多少个进程处于run的状态,b block阻塞,swpd数字一直不变没有问题,如果一直变,表明内不够用,内存与其一直在频繁的交换数据
2 0 0 737500 764 139516 0 0 75 8 38 75 0 1 98 1 0 bi从磁盘里读,bo写入磁盘,us用户占用cpu的百分比
0 0 0 737484 764 139516 0 0 0 0 20 27 0 0 100 0 0
0 0 0 737484 764 139516 0 0 0 0 18 11 0 0 100 0 0
0 0 0 737484 764 139516 0 0 0 0 14 17 0 0 100 0 0
0 0 0 737484 764 139516 0 0 0 0 18 13 0 1 99 0 0
[root@lizhipeng01 ~]#
top - 18:17:22 up 39 min, 1 user, load average: 0.00, 0.01, 0.05
Tasks: 346 total, 2 running, 344 sleeping, 0 stopped, 0 zombie zombiez僵尸进程
%Cpu(s): 0.0 us, 0.0 sy, 0.0 ni,100.0 id, 0.0 wa, 0.0 hi, 0.0 si, 0.0 st st偷走的cpu
KiB Mem : 1003160 total, 735896 free, 126072 used, 141192 buff/cache 内存情况
KiB Swap: 2097148 total, 2097148 free, 0 used. 728840 avail Mem
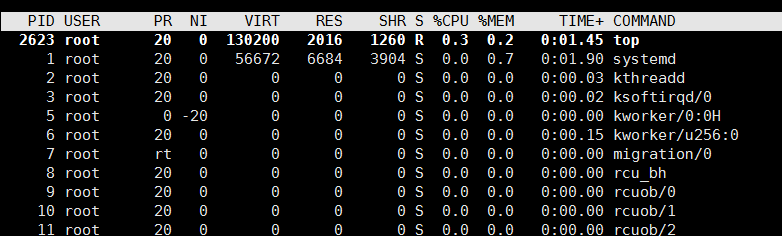
按数字1,来回切换cpu,M按内存使用排序,P按CPU使用排序,q退出来 top -c能够显示到具体的进程,全局的路径
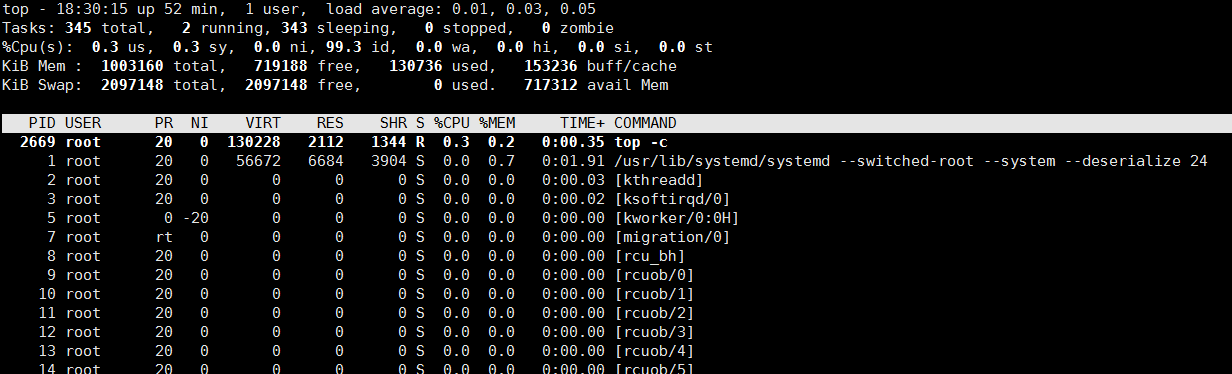
top -bn1 静态显示,适合写脚本
[root@lizhipeng01 ~]# sar
-bash: sar: 未找到命令
[root@lizhipeng01 ~]# yum install -y sysstat
[root@lizhipeng01 ~]# sar
无法打开 /var/log/sa/sa21: 没有那个文件或目录
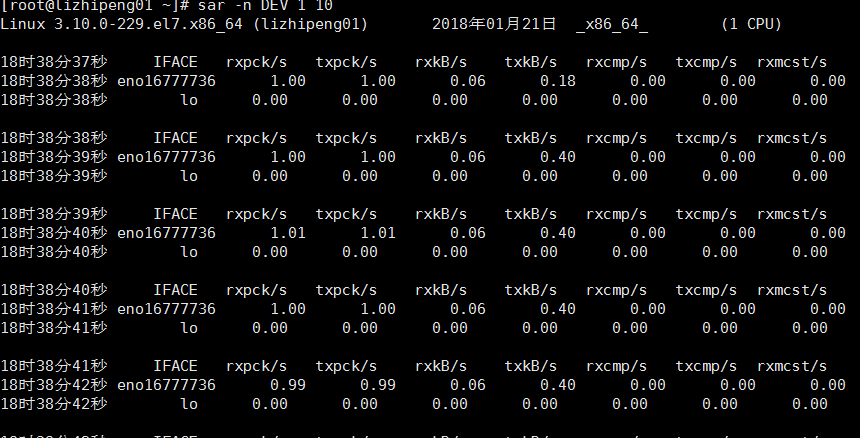
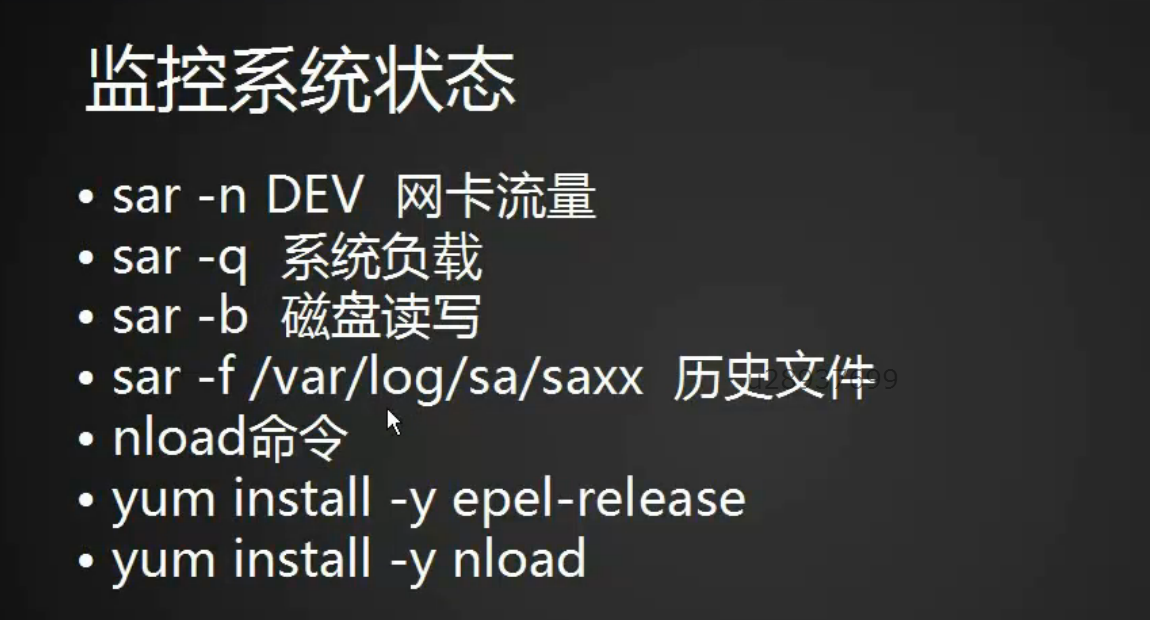
数据包rxpck几千正常,上万就不正常了
[root@lizhipeng01 ~]# sar 不再报错
Linux 3.10.0-229.el7.x86_64 (lizhipeng01) 2018年01月21日 _x86_64_ (1 CPU)
[root@lizhipeng01 ~]# ls /var/log/sa/
sa21
[root@lizhipeng01 ~]# sar -n DEV -f /var/log/sa/sa21
Linux 3.10.0-229.el7.x86_64 (lizhipeng01) 2018年01月21日 _x86_64_ (1 CPU)
[root@lizhipeng01 ~]# sar -q
Linux 3.10.0-229.el7.x86_64 (lizhipeng01) 2018年01月21日 _x86_64_ (1 CPU)
18时40分01秒 runq-sz plist-sz ldavg-1 ldavg-5 ldavg-15 blocked
18时50分01秒 1 363 0.00 0.01 0.05 0
平均时间: 1 363 0.00 0.01 0.05 0
[root@lizhipeng01 ~]# sar -b
Linux 3.10.0-229.el7.x86_64 (lizhipeng01) 2018年01月21日 _x86_64_ (1 CPU)
18时40分01秒 tps rtps wtps bread/s bwrtn/s
18时50分01秒 0.05 0.00 0.05 0.00 0.47
平均时间: 0.05 0.00 0.05 0.00 0.47
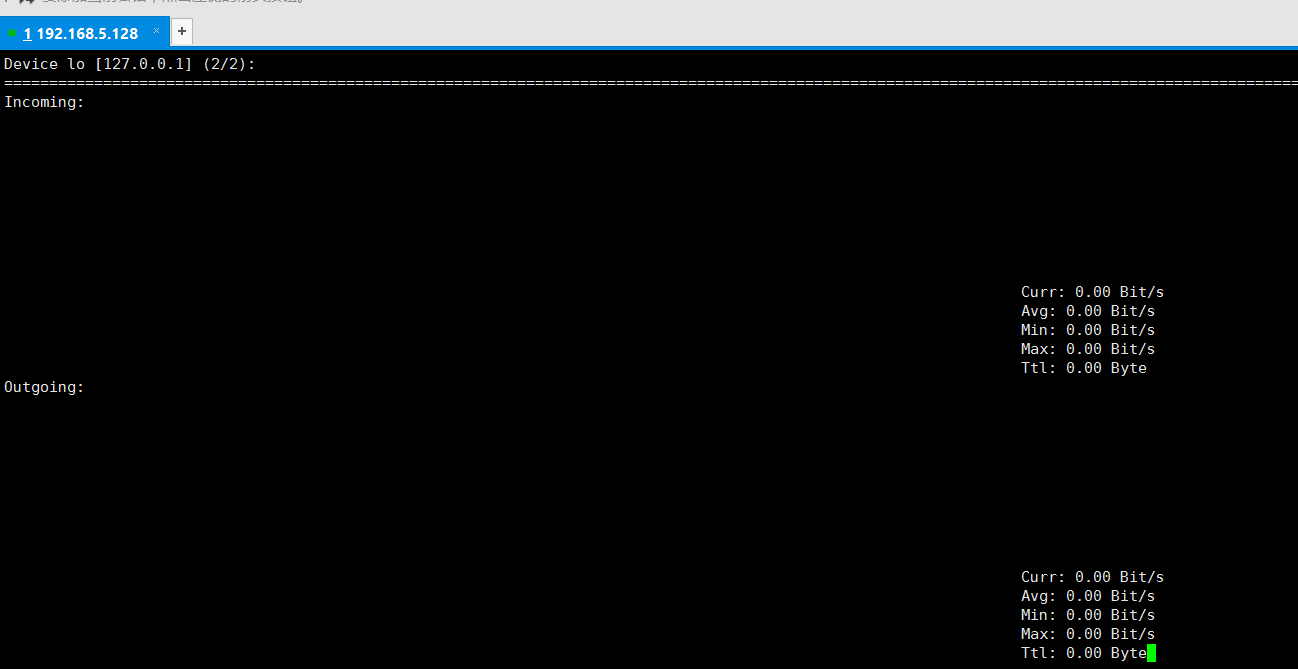
[root@lizhipeng01 ~]# nload
-bash: nload: 未找到命令
[root@lizhipeng01 ~]# yum install nload
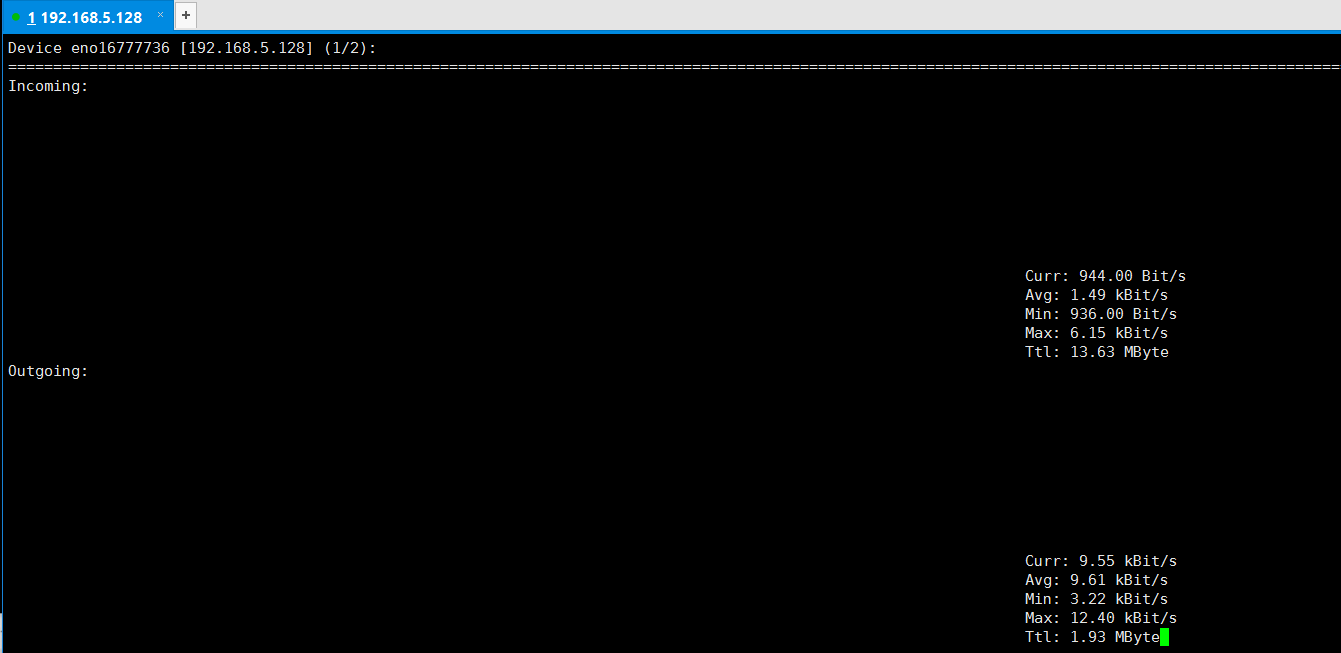
->