参考链接:https://www.backtrader.com/blog/posts/2015-09-25-tickdata-resample/resample-tickdata/
backtrader could already do resampling up from minute data. Accepting tick data was not a problem, by simply setting the 4 usual fields (open, high, low, close) to the tick value.
backtrader已经可以从微小数据进行重新采样。接受点数据不是问题,只要简单地将4个常用字段(open, high, low, close)设置为点值。
But passing the tick data to be resampled produced the same data again. As or release 1.1.11.88 this is no longer so. Now
但是传递要重新采样的tick数据会再次产生相同的数据。现在已经不是1.1.11.88版本了。
-
TimeFrame (backtrader.TimeFrame) has been extended to contain constants and names for “Ticks”, “MicroSeconds” and “Seconds”
- 时间帧(backtrader.TimeFrame)被扩展为包含“Ticks”、“MicroSeconds”和“Seconds”的常量和名称。
-
Resampling can manage the 3 aforementioned timeframes and sample them up.
- 重新采样可以管理上述3个时间框架和样本。
Note
Because tick data is the lowest possible timeframe it can actually be “compressed” (n bars to 1 bar) but not be sampled up from a smallest timeframe.
因为tick数据是最低可能的时间框架,它实际上可以被“压缩”(n条到1条),但不能从最小的时间框架进行采样。
The new release contains a small tickdata.csv sample added to the sources data a new sample script resample-tickdata.py to play with it.
新版本包含一个添加到源数据的小示例tickdata.csv,一个新的示例脚本resams -tickdata.py来处理它。
Note
Updated the script to use the new Cerebro.resampledata method which avoids the need to manually instantiate a backtrader.DataResampler
更新了脚本以使用新的Cerebro.resampledata方法,避免了手动实例化backtrader.DataResampler
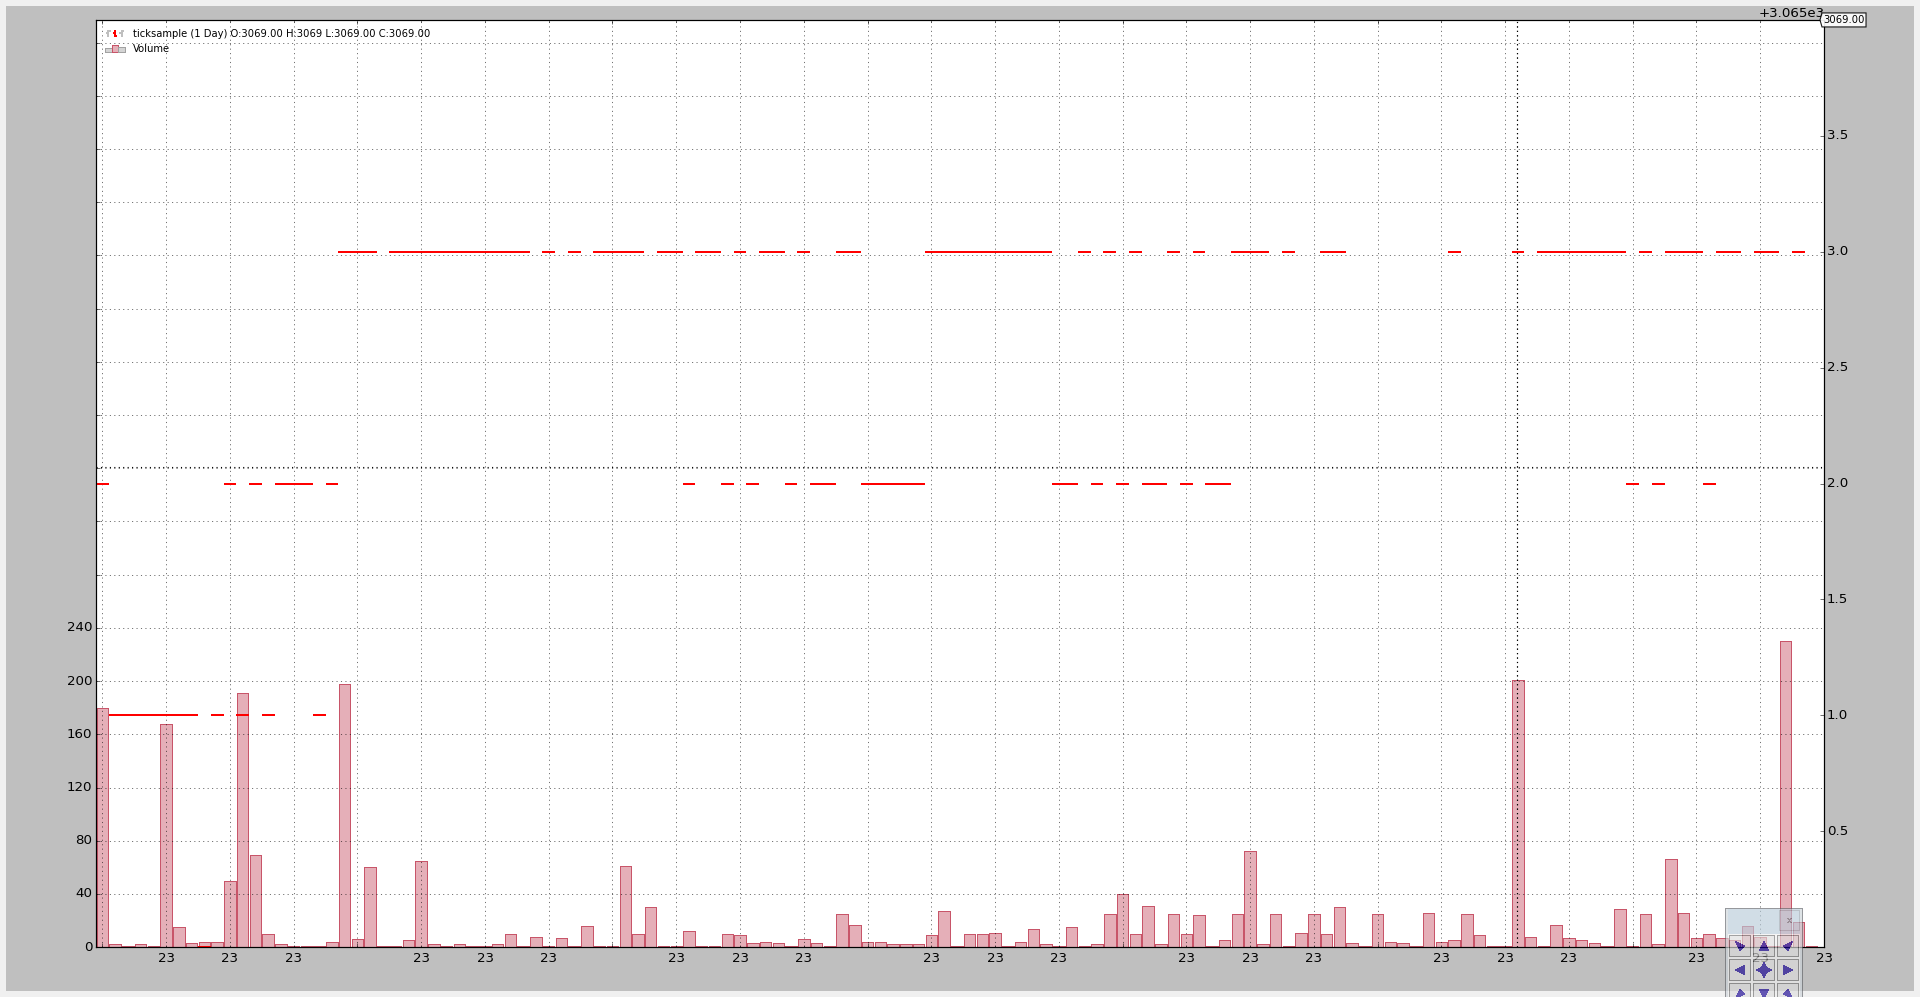
The default execution doesn’t touch the data:
默认的操作不会接触到数据
$ ./resample-tickdata.py
Producing this chart:
产生的图形:
Compressing 3 ticks to 1:
压缩三个ticks到1个:
$ ./resample-tickdata.py --timeframe ticks --compression 3
Producing this chart: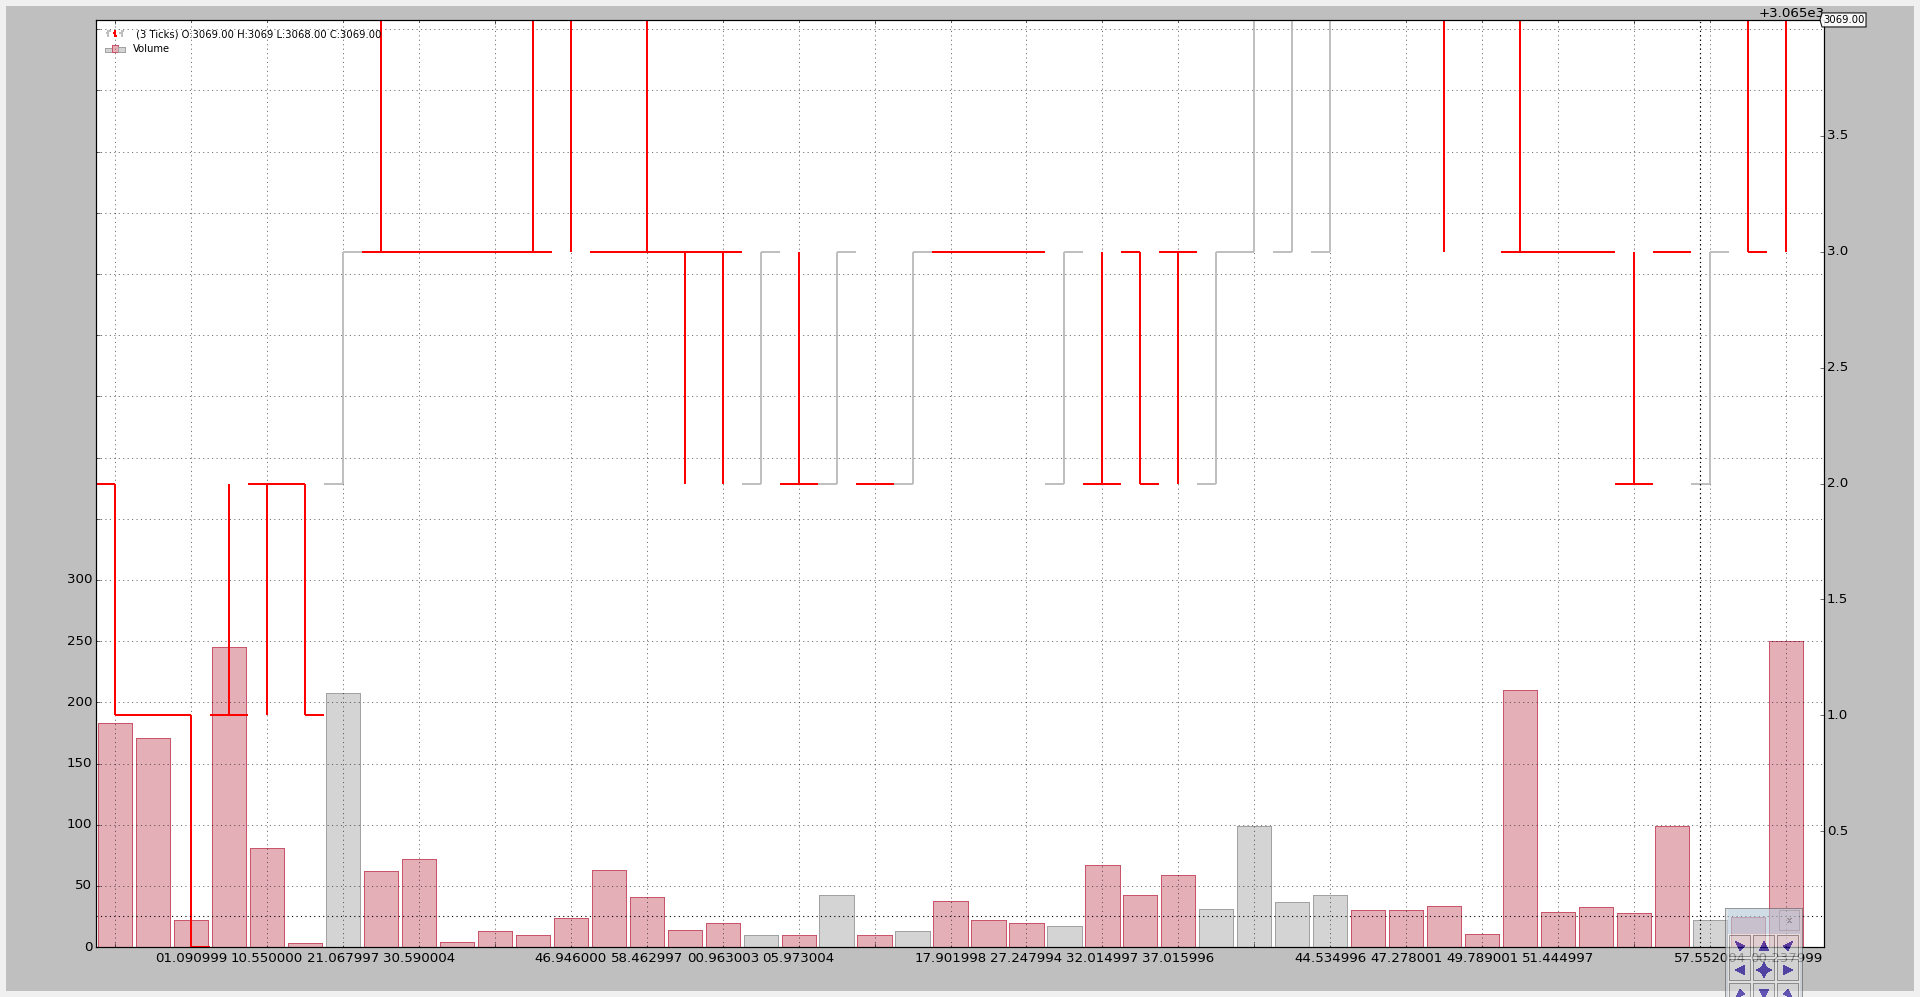
After the compression we no longer have single “ticks” but “bars”.
在压缩之后,我们不再有单一的“刻度”,而是“条”。
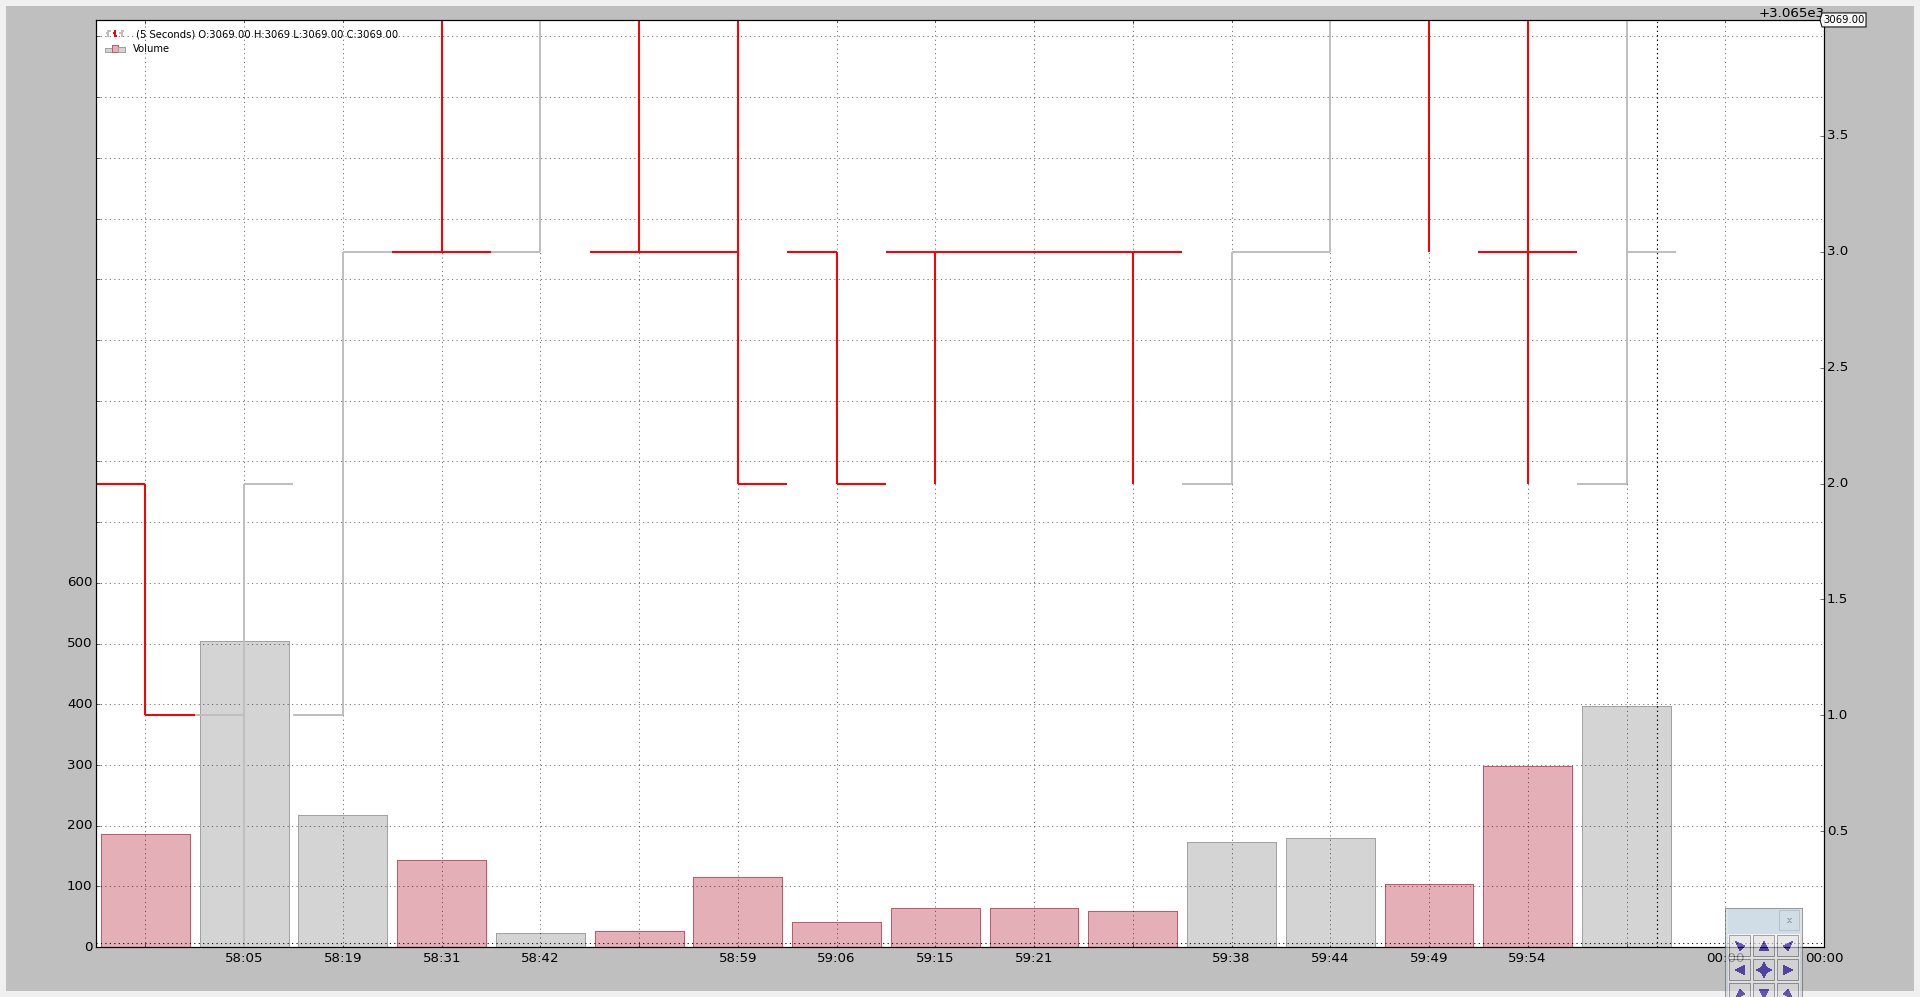
Now compressing to seconds and 5 bars compression:
现在压缩到秒和5条压缩:
$ ./resample-tickdata.py --timeframe seconds --compression 5
With a new chart:
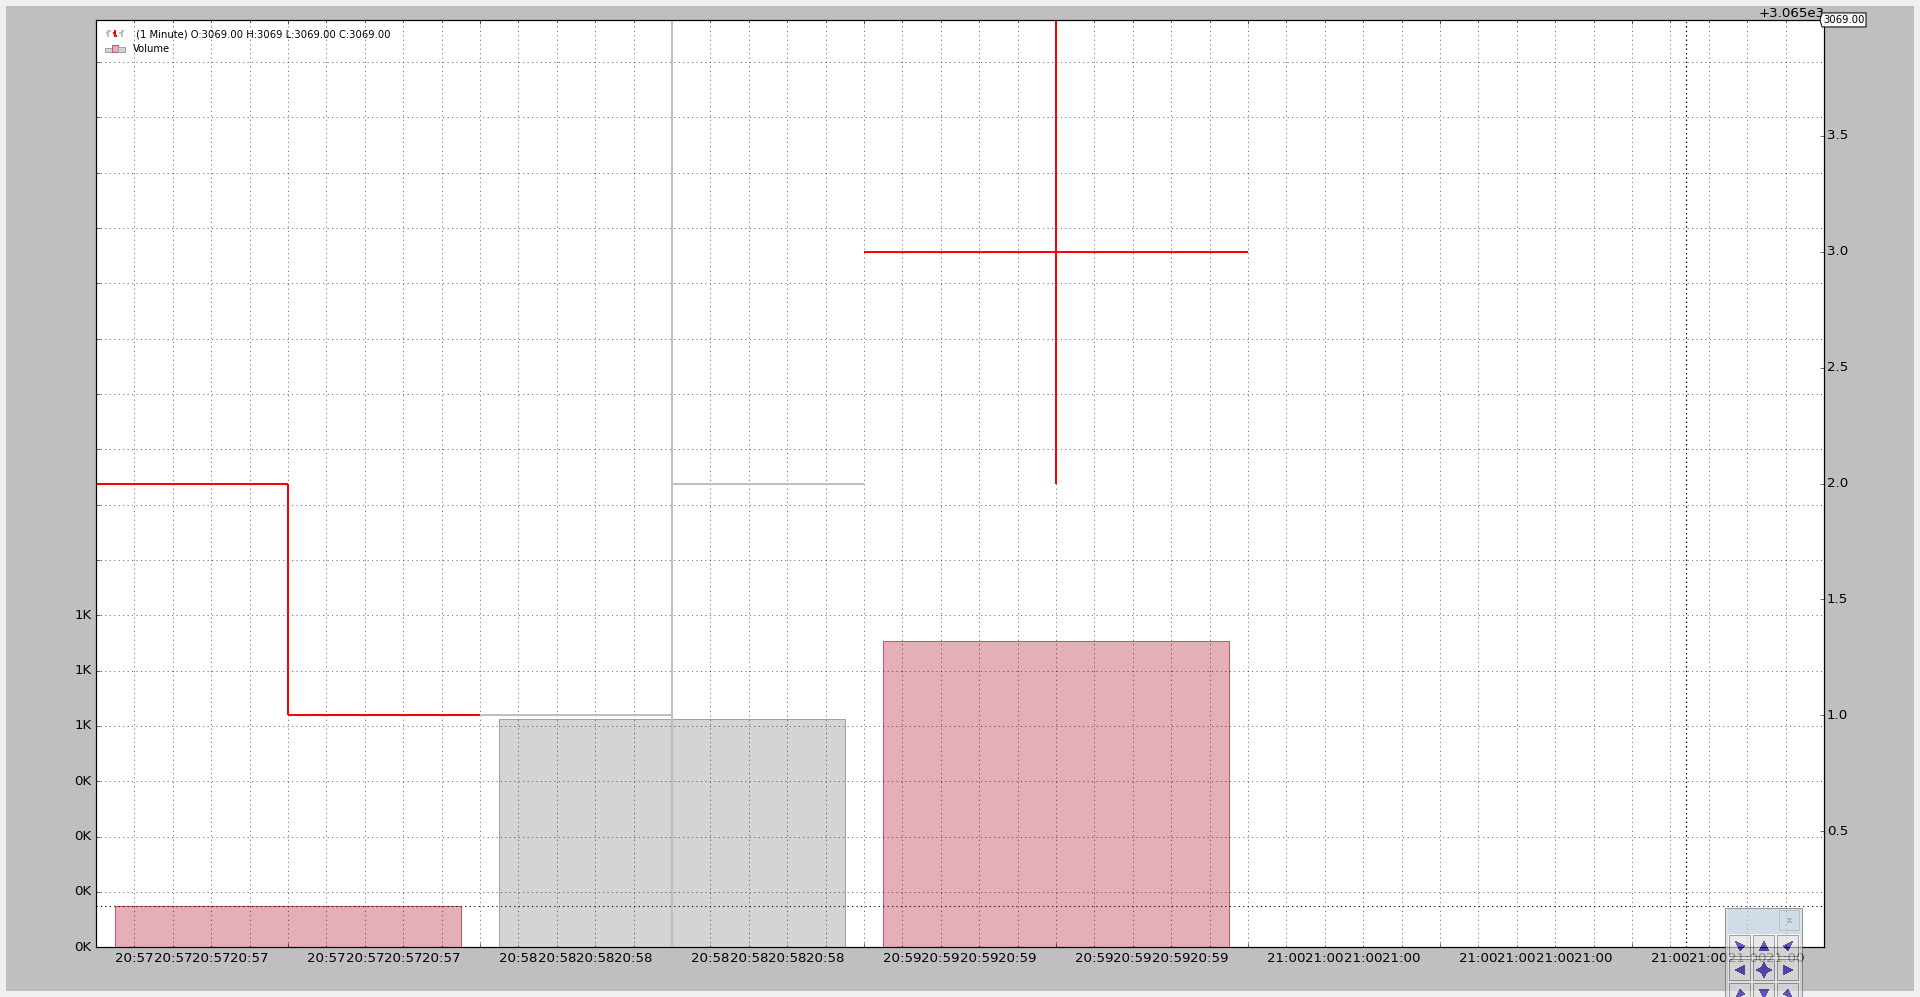
And finally to minutes. The sample data contains tick data from 4 different minutes (the last tick in the file is the only tick for the 4th minute):
最后是分钟数据。示例数据包含4分钟的tick数据(文件中的最后一个tick是第4分钟的唯一tick):
$ ./resample-tickdata.py --timeframe minutes
With a 4 bars (at the top it can be seen the final price was 3069). The 4th bar is a single point given for this minute a single tick is present in the file.
4个bars(在顶部可以看到最终价格是3069)。第4个bar是为这分钟给定的一个单点,文件中有一个单点。
The script usage:
$ ./resample-tickdata.py --help
usage: resample-tickdata.py [-h] [--dataname DATANAME]
                            [--timeframe {ticks,microseconds,seconds,minutes,daily,weekly,monthly}]
                            [--compression COMPRESSION]

Resampling script down to tick data

optional arguments:
  -h, --help            show this help message and exit
  --dataname DATANAME   File Data to Load
  --timeframe {ticks,microseconds,seconds,minutes,daily,weekly,monthly}
                        Timeframe to resample to
  --compression COMPRESSION
                        Compress n bars into 1
And the code.
from __future__ import (absolute_import, division, print_function,
                        unicode_literals)

import argparse

import backtrader as bt
import backtrader.feeds as btfeeds


def runstrat():
    args = parse_args()

    # Create a cerebro entity
    cerebro = bt.Cerebro(stdstats=False)

    # Add a strategy
    cerebro.addstrategy(bt.Strategy)

    # Load the Data
    datapath = args.dataname or '../../datas/ticksample.csv'

    data = btfeeds.GenericCSVData(
        dataname=datapath,
        dtformat='%Y-%m-%dT%H:%M:%S.%f',
        timeframe=bt.TimeFrame.Ticks,
    )

    # Handy dictionary for the argument timeframe conversion
    tframes = dict(
        ticks=bt.TimeFrame.Ticks,
        microseconds=bt.TimeFrame.MicroSeconds,
        seconds=bt.TimeFrame.Seconds,
        minutes=bt.TimeFrame.Minutes,
        daily=bt.TimeFrame.Days,
        weekly=bt.TimeFrame.Weeks,
        monthly=bt.TimeFrame.Months)

    # Resample the data
    data = cerebro.resampledata(data,
                                timeframe=tframes[args.timeframe],
                                compression=args.compression)

    # add a writer
    cerebro.addwriter(bt.WriterFile, csv=True)

    # Run over everything
    cerebro.run()

    # Plot the result
    cerebro.plot(style='bar')


def parse_args():
    parser = argparse.ArgumentParser(
        description='Resampling script down to tick data')

    parser.add_argument('--dataname', default='', required=False,
                        help='File Data to Load')

    parser.add_argument('--timeframe', default='ticks', required=False,
                        choices=['ticks', 'microseconds', 'seconds',
                                 'minutes', 'daily', 'weekly', 'monthly'],
                        help='Timeframe to resample to')

    parser.add_argument('--compression', default=1, required=False, type=int,
                        help=('Compress n bars into 1'))

    return parser.parse_args()


if __name__ == '__main__':
    runstrat()
经过调试,可以在策略里面调试使用。后面就可以通过这种格式进行时间的压缩。