The time is gone and testing a strategy against a fully formed and closed bar is good, but it could be better.
时间一去不复返了,针对一个完全成形的封闭式bar测试一种策略是好的,但也可能更好
This is where Data Replay comes in to help. If:
这就是数据重放的作用。如果:
- The strategy operates on data with a timeframe X (example: daily)
and
- Data for a smaller timeframe Y (example: 1 minute) is available
一个策略在时间框架X(日级别)操作数据和更小的时间框架Y(1分钟)数据可用
Data replay does exactly what the name implies:
据回放顾名思义:
- Replay a daily bar using the 1 minute data
- 用1分钟的数据重放一天的bar
This is of course not exactly how the market developed, but it is far better than looking at the daily fully formed and closed bar in isolation:
当然,这并不完全是市场发展的方式,但它远比孤立地观察日和关闭的bar要好得多:
If the strategy operates in realtime during the formation of the daily bar, the approximation of the formation of the bar gives a chance to replicate the actual behavior of the strategy under real conditions
如果策略在日条形成过程中是实时运行的,那么对条形成的近似值就有机会在实际条件下复制策略的实际行为
Putting Data Replay into action follows the regular usage patterns of backtrader
按照交易者的常规操作模式进行数据回放
-
Load a data feed
- 读取数据传输
-
Pass the data to cerebro with
replaydata - 通过replaydata将数据传递给cerebro
-
Add a strategy
- 添加一个策略
Note
Preloading is not supported when data is being replayed because each bar is actually built in real-time. It will automatically disabled in any Cerebro instance.
数据回放时不支持预加载,因为每个bar实际上是实时构建的。它会在任何Cerebro实例中自动禁用。
Parameters which can be passed to replaydata:
可传递给replaydata的参数:
-
timeframe(default: bt.TimeFrame.Days)Destination timeframe which to be useful has to be equal or larger than the source
- 目标时间框架必须等于或大于源时间框架
-
compression(default: 1)Compress the selected value “n” to 1 bar
- 压缩可以是1或者n
Extended parameters (do not touch if not really needed):
-
bar2edge(default: True)replays using time boundaries as the target of the closed bar. For example with a “ticks -> 5 seconds” the resulting 5 seconds bars will be aligned to xx:00, xx:05, xx:10 …
- 使用时间边界作为目标重新采样。例如,对于“ticks-> 5秒”,得到的5秒bars将对齐到xx:00、xx:05、xx:10…
-
adjbartime(default: False)Use the time at the boundary to adjust the time of the delivered resampled bar instead of the last seen timestamp. If resampling to “5 seconds” the time of the bar will be adjusted for example to hh:mm:05 even if the last seen timestamp was hh:mm:04.33
- 使用边界处的时间来调整交付的重采样条的时间,而不是最后看到的时间戳。如果重新采样到“5秒”,则条的时间将调整为hh:mm:05,即使最后看到的时间戳是hh:mm:04.3
-
NOTE: Time will only be adjusted if “bar2edge” is True. It wouldn’t make sense to adjust the time if the bar has not been aligned to a boundary
- 只有当“bar2edge”正确时,时间才会调整。如果工具条没有对齐到边界,那么调整时间就没有意义了
-
rightedge(default: True)Use the right edge of the time boundaries to set the time.
- 使用时间边界的右边界来设置时间。
-
If False and compressing to 5 seconds the time of a resampled bar for seconds between hh:mm:00 and hh:mm:04 will be hh:mm:00 (the starting boundary
- 如果为假,压缩到5秒,则重新采样的时间条在hh:mm:00和hh:mm:04之间的秒将为hh:mm:00(起始边界)
-
If True the used boundary for the time will be hh:mm:05 (the ending boundary)
- 如果为真,使用的时间边界将是hh:mm:05(结束边界)
For the sake of working with a example the standard 2006 daily data will be replayed on a weekly basis. Which means:
为了举例说明,标准的2006年每日数据将每周重播一次。也就是说:
-
There will finally be 52 bars, one for each week
- 最后会有52个bars,每周一个
-
Cerebro will call
prenextandnexta total of 255 times, which is the original count of daily bars - Cerebro将调用prenext和next共255次,这是每日bar的原始计数
The trick:
诀窍
-
When a weekly bar is forming, the length (
len(self)) of the strategy will remain unchanged. - 当一个周线形成时,策略的长度(len(self))将保持不变。
-
With each new week the length will increase by one
- 每过一个星期,长度就会增加一个
Some examples below, but first the sauce of the test script in which the data is loaded and passed to cerebro with replaydata … and then run.
下面是一些例子,但是首先是测试脚本的调味料,在这个脚本中,数据被加载并用replaydata传递给cerebro…然后run。
    # Load the Data
    datapath = args.dataname or '../../datas/2006-day-001.txt'
    data = btfeeds.BacktraderCSVData(dataname=datapath)

    # Handy dictionary for the argument timeframe conversion
    tframes = dict(
        daily=bt.TimeFrame.Days,
        weekly=bt.TimeFrame.Weeks,
        monthly=bt.TimeFrame.Months)

    # First add the original data - smaller timeframe
    cerebro.replaydata(data,
                       timeframe=tframes[args.timeframe],
                       compression=args.compression)
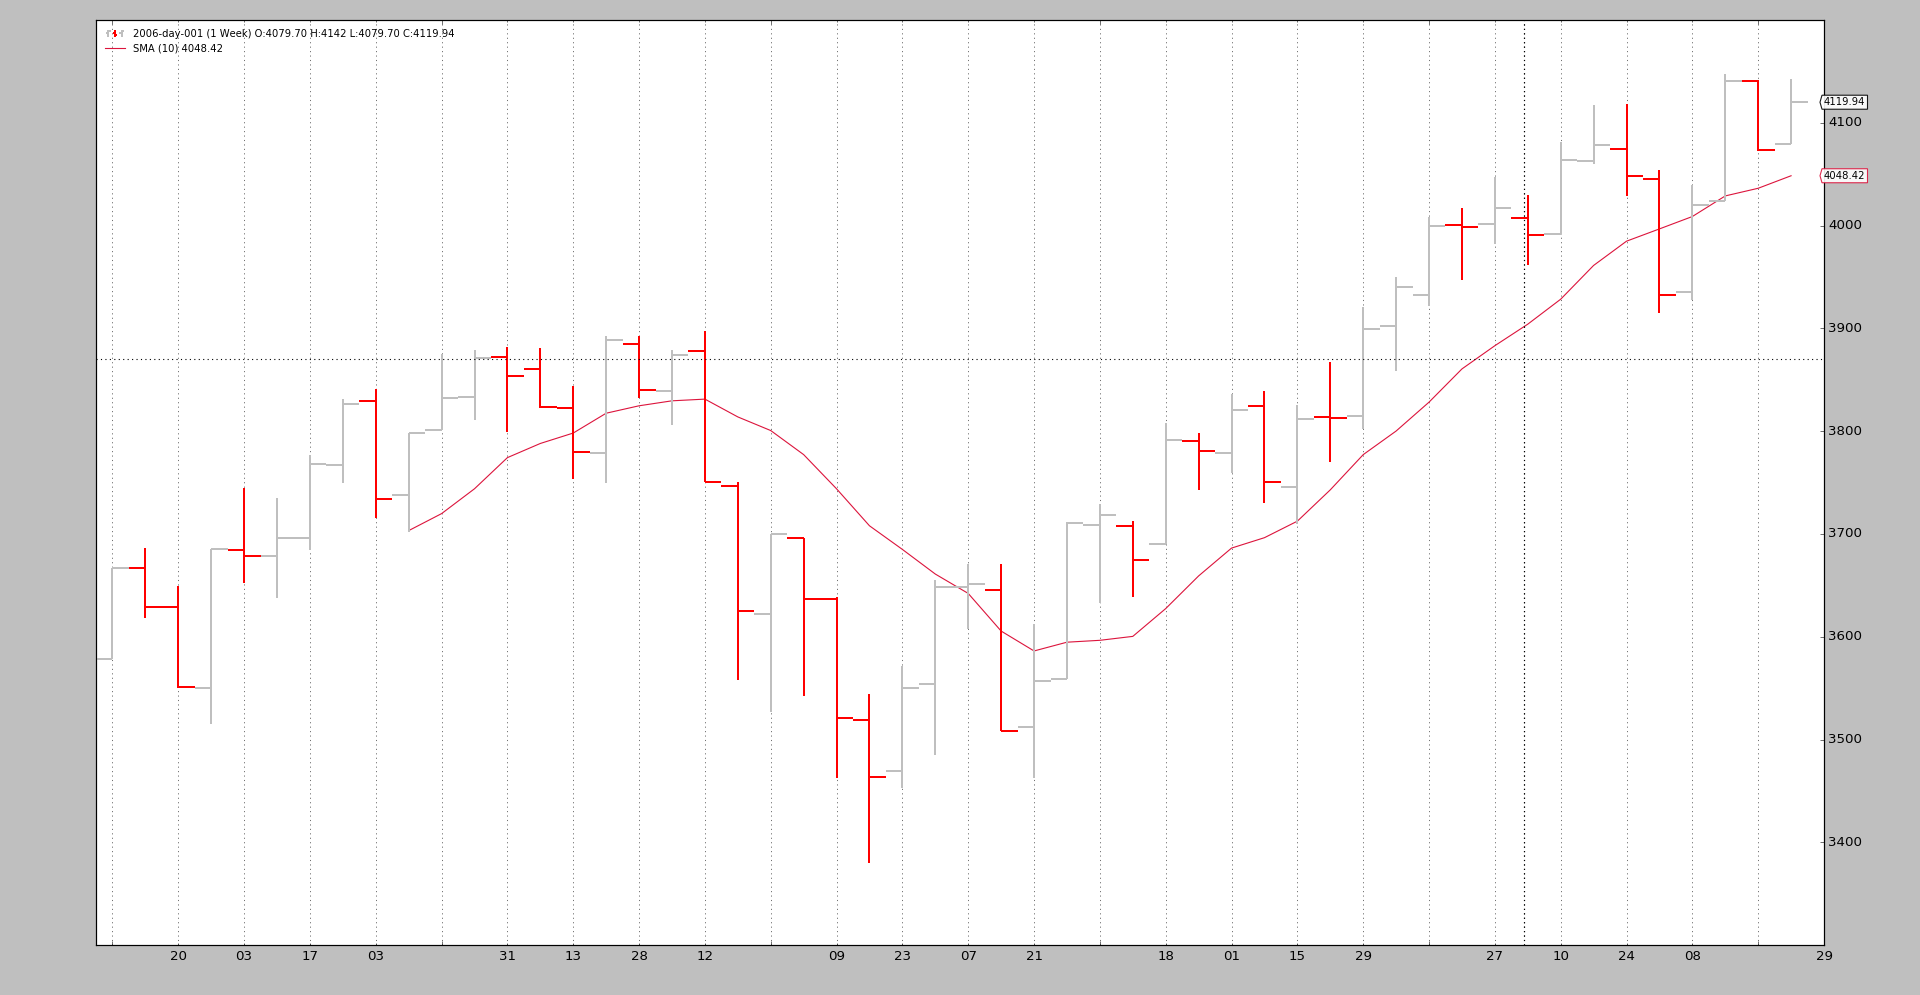
Example - Replay Daily to Weekly
The invocation of the script:
$ ./replay-example.py --timeframe weekly --compression 1
The chart cannot unfortunately show us the real thing happening in the background, so let’s have a look at the console output:
prenext len 1 - counter 1
prenext len 1 - counter 2
prenext len 1 - counter 3
prenext len 1 - counter 4
prenext len 1 - counter 5
prenext len 2 - counter 6
...
...
prenext len 9 - counter 44
prenext len 9 - counter 45
---next len 10 - counter 46
---next len 10 - counter 47
---next len 10 - counter 48
---next len 10 - counter 49
---next len 10 - counter 50
---next len 11 - counter 51
---next len 11 - counter 52
---next len 11 - counter 53
...
...
---next len 51 - counter 248
---next len 51 - counter 249
---next len 51 - counter 250
---next len 51 - counter 251
---next len 51 - counter 252
---next len 52 - counter 253
---next len 52 - counter 254
---next len 52 - counter 255
As we see the internal self.counter variable is keeping track of each call to either prenext or next. The former being called before the applied Simple Moving Average produces a value. The latter called when the Simple Moving Average is producing values.
正如我们看到的内部self.counter变量跟踪对prenext或next的每个调用。在应用简单移动平均值生成值之前调用前者。后者在简单移动平均值产生值时调用。
The key:
关键是:
- The length (len(self)) of the strategy changes every 5 bars (5 trading days in the week)
- 策略的长度(len(self))每5个交易日(每周5个交易日)变化一次
The strategy is effectively seeing:
该策略有效的看到:
-
How the weekly bar developed in 5 shots.
-
每周bar是如何在5次击中发展起来的。
This, again, doesn’t replicate the actual tick-by-tick (and not even minute, hour) development of the market, but it is better than actually seeing a bar.
- 同样,这并不能复制市场每时每刻(甚至不是每分,每小时)的发展,但这比真正的bar还好
The visual output is that of the weekly chart which is the final outcome the system is being tested again.
视觉输出是周线图,这是系统再次测试的最终结果。
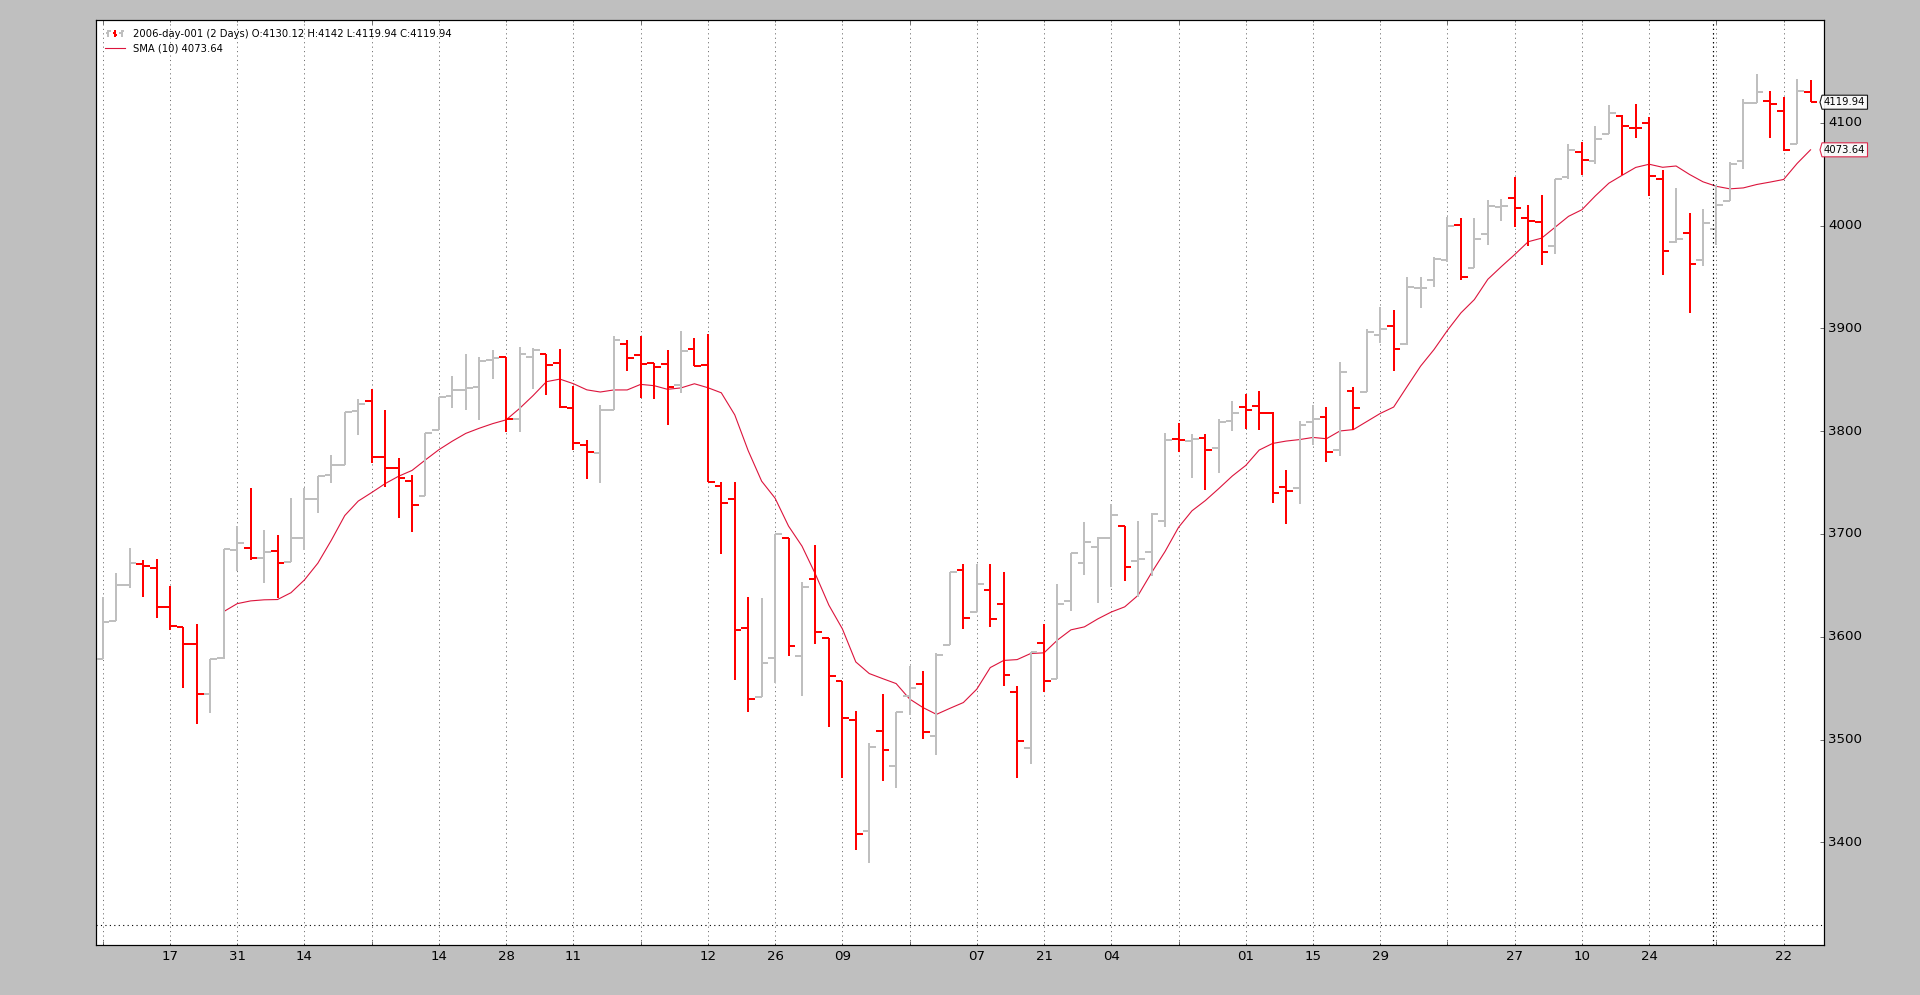
Example 2 - Daily to Daily with Compression
Of course “Replaying” can be applied to the same timeframe but with a compression.
当然,“回放”也可以应用于同一时间段,但需要压缩。
The console:
$ ./replay-example.py --timeframe daily --compression 2
prenext len 1 - counter 1
prenext len 1 - counter 2
prenext len 2 - counter 3
prenext len 2 - counter 4
prenext len 3 - counter 5
prenext len 3 - counter 6
prenext len 4 - counter 7
...
...
---next len 125 - counter 250
---next len 126 - counter 251
---next len 126 - counter 252
---next len 127 - counter 253
---next len 127 - counter 254
---next len 128 - counter 255
This time we got half the bars as expected because of the factor 2 requested compression.
这一次我们得到了一半的bars,因为系数2要求压缩。
The chart:
Conclusion
A reconstruction of the market development is possible. Usually a smaller timeframe set of data is available and can be used to discretely replay the timeframe which the system operates on.
重建市场发展是可能的。通常一个较小的时间框架数据集是可用的,可以用来离散地重播系统运行的时间框架。
The test script.
from __future__ import (absolute_import, division, print_function,
                        unicode_literals)

import argparse

import backtrader as bt
import backtrader.feeds as btfeeds
import backtrader.indicators as btind


class SMAStrategy(bt.Strategy):
    params = (
        ('period', 10),
        ('onlydaily', False),
    )

    def __init__(self):
        self.sma = btind.SMA(self.data, period=self.p.period)

    def start(self):
        self.counter = 0

    def prenext(self):
        self.counter += 1
        print('prenext len %d - counter %d' % (len(self), self.counter))

    def next(self):
        self.counter += 1
        print('---next len %d - counter %d' % (len(self), self.counter))


def runstrat():
    args = parse_args()

    # Create a cerebro entity
    cerebro = bt.Cerebro(stdstats=False)

    cerebro.addstrategy(
        SMAStrategy,
        # args for the strategy
        period=args.period,
    )

    # Load the Data
    datapath = args.dataname or '../../datas/2006-day-001.txt'
    data = btfeeds.BacktraderCSVData(dataname=datapath)

    # Handy dictionary for the argument timeframe conversion
    tframes = dict(
        daily=bt.TimeFrame.Days,
        weekly=bt.TimeFrame.Weeks,
        monthly=bt.TimeFrame.Months)

    # First add the original data - smaller timeframe
    cerebro.replaydata(data,
                       timeframe=tframes[args.timeframe],
                       compression=args.compression)

    # Run over everything
    cerebro.run()

    # Plot the result
    cerebro.plot(style='bar')


def parse_args():
    parser = argparse.ArgumentParser(
        description='Pandas test script')

    parser.add_argument('--dataname', default='', required=False,
                        help='File Data to Load')

    parser.add_argument('--timeframe', default='weekly', required=False,
                        choices=['daily', 'weekly', 'monhtly'],
                        help='Timeframe to resample to')

    parser.add_argument('--compression', default=1, required=False, type=int,
                        help='Compress n bars into 1')

    parser.add_argument('--period', default=10, required=False, type=int,
                        help='Period to apply to indicator')

    return parser.parse_args()


if __name__ == '__main__':
    runstrat()