import numpy as np
import matplotlib.pyplot as plt
from matplotlib import cm
from matplotlib.ticker import LinearLocator, FormatStrFormatter

x=np.arange(-10,10,0.5)
y=x
X,Y=np.meshgrid(x,y)

def norm_d(x1,x2,mu1,mu2,s1,s2,rho):
    num=((1)/(2*np.pi*s1*s2*np.sqrt(1-rho**2)))
    A=((x1-mu1)**2)/(s1**2)
    B=2*rho*(((x1-mu1)*(x2-mu2))/(s1*s2))
    C=((x2-mu2)**2)/(s2**2)
    D=-1/(2*(1-rho**2))*(A-B+C)
    pdf=num*np.exp(D)
    return 2dnm

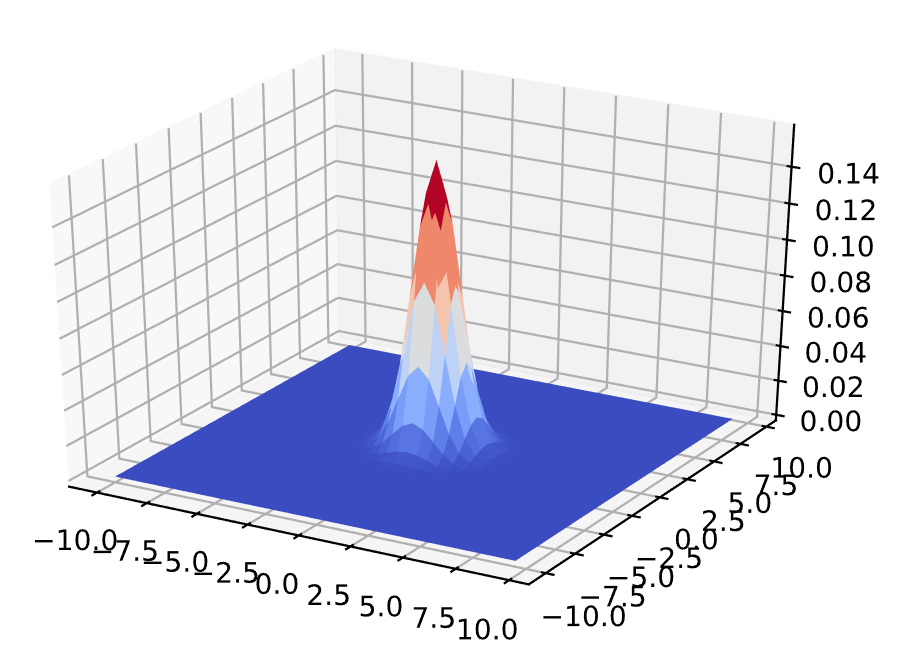
R=norm_d(X,Y,0,0,1,3,0.75)
fig = plt.figure()
ax = fig.gca(projection='3d')
surf = ax.plot_surface(X, Y, R, cmap=cm.coolwarm,linewidth=0, antialiased=False)
plt.show()
(sigma_1^2=1,sigma_2^2=3, ho=0.75)

(sigma_1^2=1,sigma_2^2=1, ho=0)
