python求极值点主要用到scipy库。
1. 首先可先选择一个函数或者拟合一个函数,这里选择拟合数据:np.polyfit
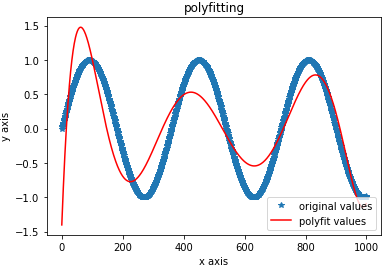
import pandas as pd
import matplotlib.pyplot as plt
import numpy as np
from scipy import signal   #滤波等

xxx = np.arange(0, 1000)
yyy = np.sin(xxx*np.pi/180)

z1 = np.polyfit(xxx, yyy, 7) # 用7次多项式拟合
p1 = np.poly1d(z1) #多项式系数
print(p1) # 在屏幕上打印拟合多项式
yvals=p1(xxx)

plt.plot(xxx, yyy, '*',label='original values')
plt.plot(xxx, yvals, 'r',label='polyfit values')
plt.xlabel('x axis')
plt.ylabel('y axis')
plt.legend(loc=4)
plt.title('polyfitting')
plt.show()
得到的图形是:
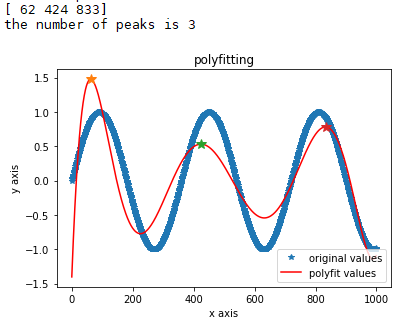
2. 求波峰值,也就是极大值,得到:signal.find_peaks,官方文档:https://docs.scipy.org/doc/scipy/reference/generated/scipy.signal.find_peaks.html#scipy-signal-find-peaks。
scipy.signal.find_peaks(x, height=None, threshold=None, distance=None, prominence=None, width=None, wlen=None, rel_height=0.5, plateau_size=None)

Parameters:
x : sequence. A signal with peaks.
height : number or ndarray or sequence, optional. Required height of peaks. Either a number, None, an array matching x or a 2-element sequence of the former. The first element is always interpreted as the minimal and the second, if supplied, as the maximal required height.
threshold : number or ndarray or sequence, optional. Required threshold of peaks, the vertical distance to its neighbouring samples. Either a number, None, an array matching x or a 2-element sequence of the former. The first element is always interpreted as the minimal and the second, if supplied, as the maximal required threshold.
distance : number, optional. Required minimal horizontal distance (>= 1) in samples between neighbouring peaks. Smaller peaks are removed first until the condition is fulfilled for all remaining peaks.
prominence : number or ndarray or sequence, optional. Required prominence of peaks. Either a number, None, an array matching x or a 2-element sequence of the former. The first element is always interpreted as the minimal and the second, if supplied, as the maximal required prominence.
width : number or ndarray or sequence, optional. Required width of peaks in samples. Either a number, None, an array matching x or a 2-element sequence of the former. The first element is always interpreted as the minimal and the second, if supplied, as the maximal required width.
wlen : int, optional. Used for calculation of the peaks prominences, thus it is only used if one of the arguments prominence or width is given. See argument wlen in peak_prominences for a full description of its effects.
rel_height : float, optional. Used for calculation of the peaks width, thus it is only used if width is given. See argument rel_height in peak_widths for a full description of its effects.
plateau_size : number or ndarray or sequence, optional. Required size of the flat top of peaks in samples. Either a number, None, an array matching x or a 2-element sequence of the former. The first element is always interpreted as the minimal and the second, if supplied as the maximal required plateau size.
New in version 1.2.0.
# 极值
num_peak_3 = signal.find_peaks(yvals, distance=10) #distance表极大值点的距离至少大于等于10个水平单位
print(num_peak_3[0])
print('the number of peaks is ' + str(len(num_peak_3[0])))
plt.plot(xxx, yyy, '*',label='original values')
plt.plot(xxx, yvals, 'r',label='polyfit values')
plt.xlabel('x axis')
plt.ylabel('y axis')
plt.legend(loc=4)
plt.title('polyfitting')
for ii in range(len(num_peak_3[0])):
    plt.plot(num_peak_3[0][ii], yvals[num_peak_3[0][ii]],'*',markersize=10)
plt.show()
3. 在可导的情形下,可以求导来求极值点,同时得到极大值和极小值点:np.polyder
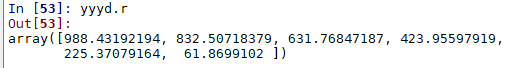
yyyd = np.polyder(p1,1) # 1表示一阶导
print(yyyd)
此时:yyyd.r 即可就得导数为0的点,可以与上述的极大值点对应比较
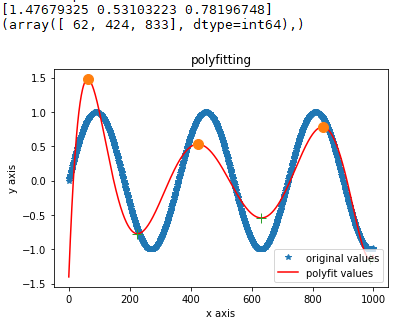
4. 直接函数分别求极大值和极小值:signal.argrelextrema 函数
print(yvals[signal.argrelextrema(yvals, np.greater)]) #极大值的y轴, yvals为要求极值的序列
print(signal.argrelextrema(yvals, np.greater))  #极大值的x轴
peak_ind = signal.argrelextrema(yvals,np.greater)[0] #极大值点,改为np.less即可得到极小值点
plt.plot(xxx, yyy, '*',label='original values')
plt.plot(xxx, yvals, 'r',label='polyfit values')
plt.xlabel('x axis')
plt.ylabel('y axis')
plt.legend(loc=4)
plt.title('polyfitting')
plt.plot(signal.argrelextrema(yvals,np.greater)[0],yvals[signal.argrelextrema(yvals, np.greater)],'o', markersize=10)  #极大值点
plt.plot(signal.argrelextrema(yvals,np.less)[0],yvals[signal.argrelextrema(yvals, np.less)],'+', markersize=10)  #极小值点
plt.show()
## ----- end ------