1、subplot布局
subplot(nrows, ncols, index, **kwargs)
subplot(pos, **kwargs)
subplot(ax)
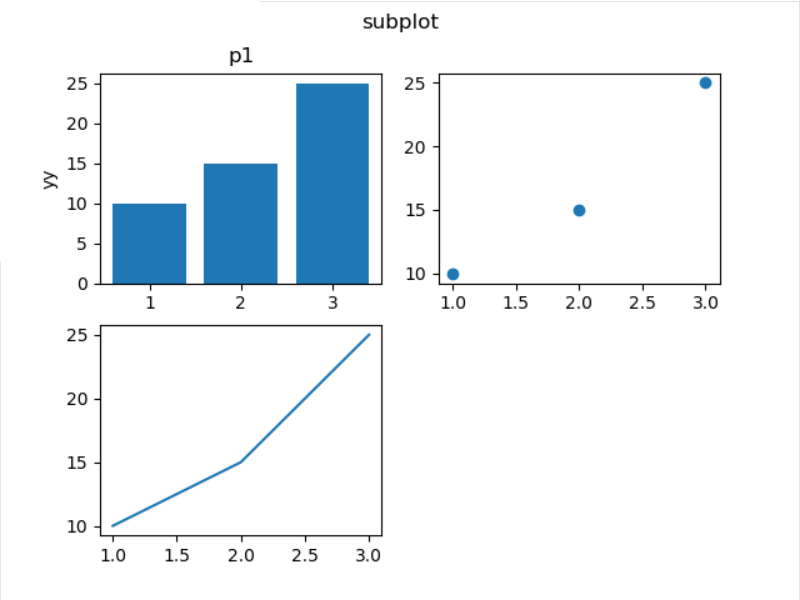
x=[1,2,3]
values = [10, 15, 25]
p1=plt.subplot(221)
plt.bar(x, values)
p1.set_ylabel('yy')
p1.set_title('p1')

plt.subplot(222)
plt.scatter(x, values)

plt.subplot(223)
plt.plot(x, values)
plt.suptitle('subplot')
plt.show()
上面的图第三张只占半个图纸长度,不美观。那么使用subplot怎么画非对阵图呢?重新定义子图的分布行列即可。
plt.subplot(212) 或plt.subplot(2,1,2)把图纸分为2行1列,当前子图是第二个。
x=[1,2,3]
values = [10, 15, 25]
p1=plt.subplot(221)
plt.bar(x, values)
p1.set_ylabel('yy')
p1.set_title('p1')
plt.subplot(222)
plt.scatter(x, values)
plt.subplot(212)
plt.plot(x, values)
plt.suptitle('subplot')
plt.show()
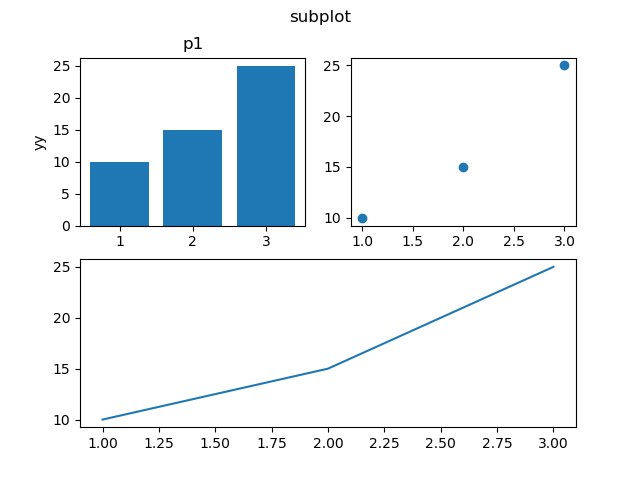
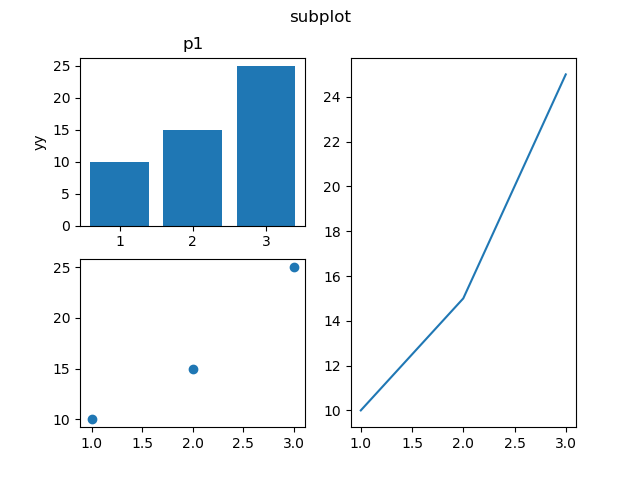
先把图纸分为2行2列,先画图1和图3,然后再把图纸划分为1行2列,对第二列绘图。
x=[1,2,3]
values = [10, 15, 25]
p1=plt.subplot(221)
plt.bar(x, values)
p1.set_ylabel('yy')
p1.set_title('p1')
plt.subplot(223)
plt.scatter(x, values)
plt.subplot(1,2,2)
plt.plot(x, values)
plt.suptitle('subplot')
plt.show()
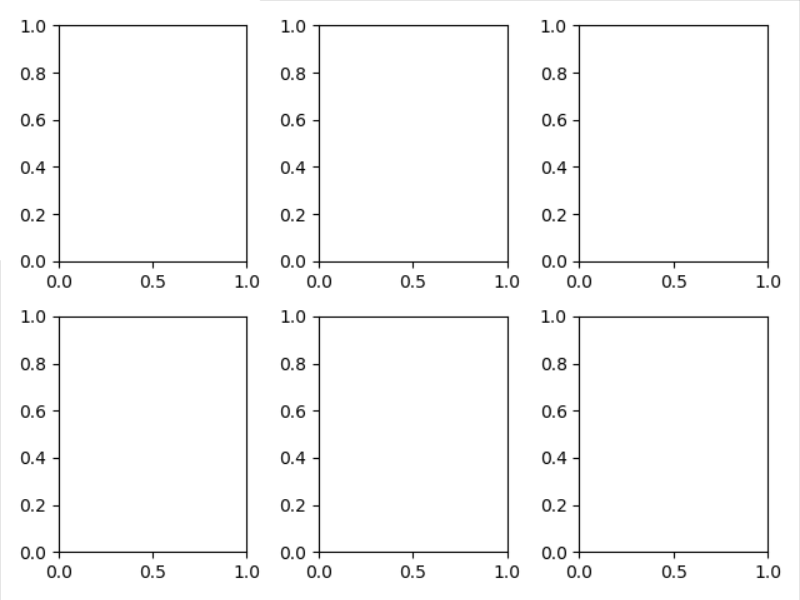
2、subplots布局
matplotlib.pyplot.subplots(nrows=1, ncols=1, sharex=False, sharey=False, squeeze=True, subplot_kw=None, gridspec_kw=None, **fig_kw) :创建一个图形和一组子图。
fig, ax = plt.subplots(2, 3)
fig.tight_layout()
ax[0].text(0.5,0.5, 'sss')
plt.show()
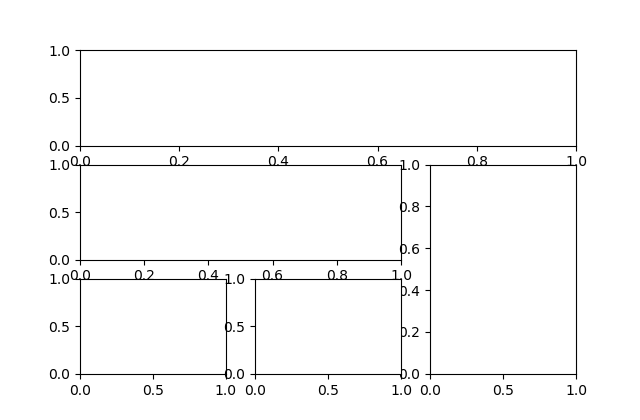
3、subplot2grid布局
matplotlib.pyplot.subplot2grid(shape, loc, rowspan=1, colspan=1, fig=None, **kwargs)
shape : sequence of 2 ints
loc : sequence of 2 ints
rowspan : int
Number of rows for the axis to span to the right.
colspan : int
Number of columns for the axis to span downwards.
fig = plt.figure()
ax1 = plt.subplot2grid((3, 3), (0, 0), colspan=3)
ax2 = plt.subplot2grid((3, 3), (1, 0), colspan=2)
ax3 = plt.subplot2grid((3, 3), (1, 2), rowspan=2)
ax4 = plt.subplot2grid((3, 3), (2, 0))
ax5 = plt.subplot2grid((3, 3), (2, 1))
plt.show()
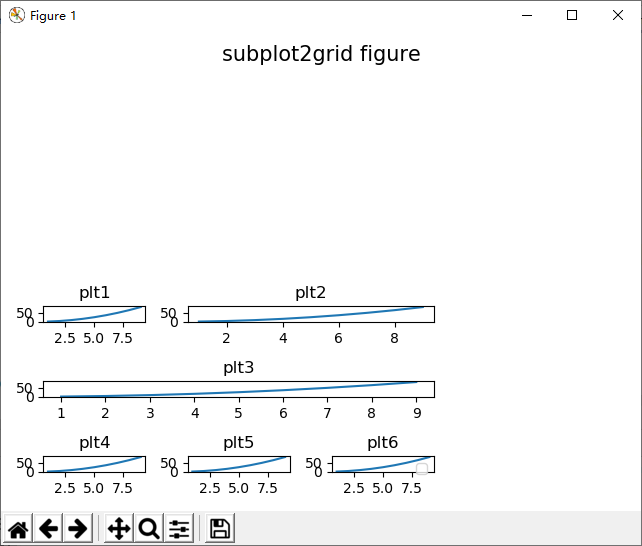
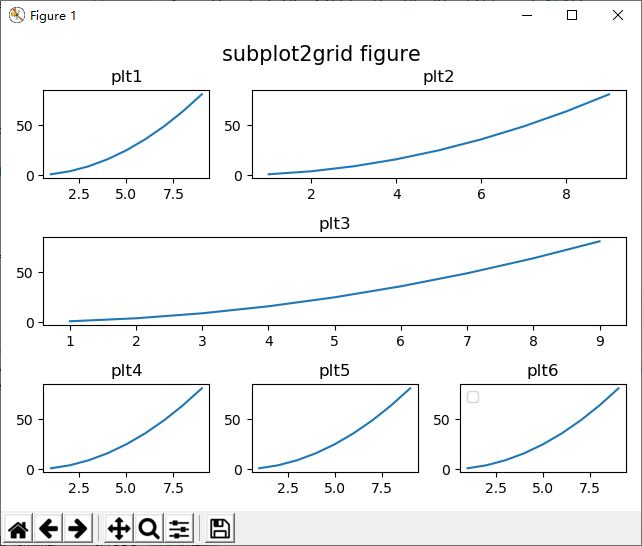
x = np.arange(1,10)
fig = plt.figure()
ax1 = plt.subplot2grid((3, 3), (0, 0), colspan=1, title = 'plt1')
ax1.plot(x,x*x)
ax2 = plt.subplot2grid((3, 3), (0, 1), colspan=2, title = 'plt2')
ax2.plot(x,x*x)
ax3 = plt.subplot2grid((3, 3), (1, 0), colspan=3, title = 'plt3')
ax3.plot(x,x*x)
ax4 = plt.subplot2grid((3, 3), (2, 0), title = 'plt4')
ax4.plot(x,x*x)
ax5 = plt.subplot2grid((3, 3), (2, 1), title = 'plt5')
ax5.plot(x,x*x)
ax6 = plt.subplot2grid((3, 3), (2, 2), title = 'plt6')
ax6.plot(x,x*x)
plt.legend()
plt.suptitle('subplot2grid figure',  x=0.5,y=0.95, ha='center', va='center', fontsize=15)
plt.show()
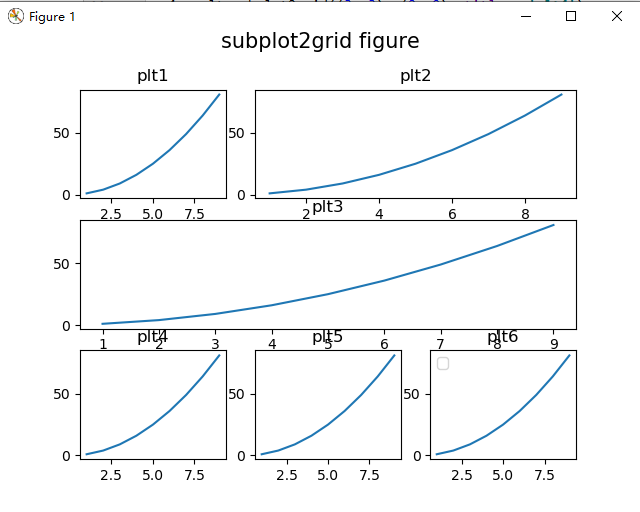
可见上面的图,x周名称和附件的图互相干涉。需要缩小图或者加大间隙。
使用layout函数plt.tight_layout()。但是图的title和第一行干涉。
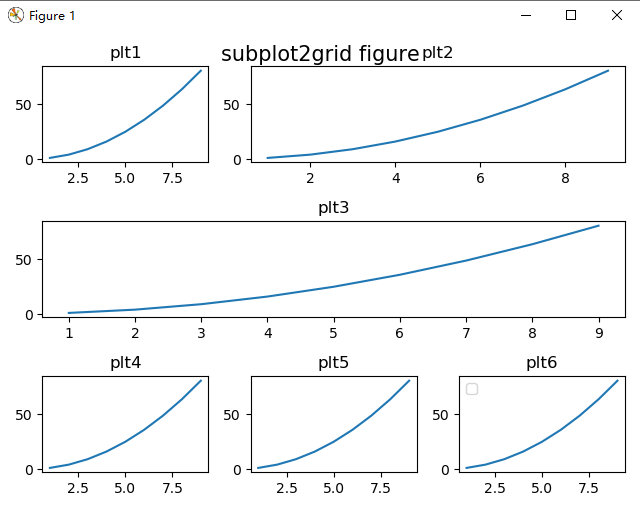
plt.tight_layout(rect=[0, 0, 1, 0.95]) 或者添加一句fig.subplots_adjust(top=0.85)即可。
matplotlib.pyplot.tight_layout(pad=1.08, h_pad=None, w_pad=None, rect=None)
其中rect可以这样定义:[left, bottom, right, top] in normalized (0, 1) figure coordinates,所以可以定义right和top,进行图的缩放。
A rectangle (left, bottom, right, top) in the normalized figure coordinate that the whole subplots area (including labels) will fit into. Default is (0, 0, 1, 1).
图的缩放,做个实验plt.tight_layout(rect=[0, 0, 0.7, 0.5])