导入必要的库
import math
import matplotlib.pyplot as plt
import numpy as np
import matplotlib as mpl
mpl.rcParams['axes.unicode_minus'] = False
绘制softmax函数图像
fig = plt.figure(figsize=(6,4))
ax = fig.add_subplot(111)
x = np.linspace(-10,10)
y = sigmoid(x)

ax.spines['top'].set_color('none')
ax.spines['right'].set_color('none')

ax.xaxis.set_ticks_position('bottom')
ax.spines['bottom'].set_position(('data',0))
ax.set_xticks([-10,-5,0,5,10])
ax.yaxis.set_ticks_position('left')
ax.spines['left'].set_position(('data',0))
ax.set_yticks([-1,-0.5,0.5,1])

plt.plot(x,y,label = 'Softmax',linestyle='-',color='blue')
plt.legend(['Softmax'])
plt.savefig('softmax.png')

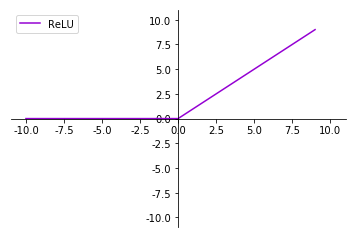
绘制Relu激活函数图像
fig =  plt.figure(figsize=(6,4))
ax = fig.add_subplot(111)
x = np.arange(-10,10)
y = np.where(x<0,0,x) # 小于0输出0,大于0输出y
plt.xlim(-11,11)
plt.ylim(-11,11)

ax = plt.gca() # 获得当前axis坐标轴对象
ax.spines['right'].set_color('none') # 去除右边界线
ax.spines['top'].set_color('none') # 去除上边界线

ax.xaxis.set_ticks_position('bottom') # 指定下边的边作为x轴
ax.yaxis.set_ticks_position('left') # 指定左边的边为y轴

ax.spines['bottom'].set_position(('data',0)) # 指定data 设置的bottom(也就是指定的x轴)绑定到y轴的0这个点上
ax.spines['left'].set_position(('data',0))  # 指定y轴绑定到x轴的0这个点上

plt.plot(x,y,label = 'ReLU',linestyle='-',color='darkviolet')
plt.legend(['ReLU'])
plt.savefig('relu.png')
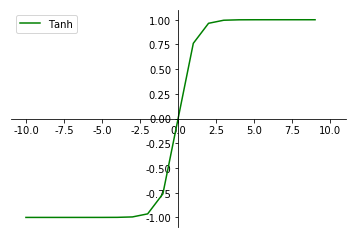
绘制Tanh激活函数图像
x = np.arange(-10,10)
a = np.array(x)
y = (math.e**(x) - math.e**(-x)) / (math.e**(x) + math.e**(-x))

plt.xlim(-11,11)
ax = plt.gca()
ax.spines['right'].set_color('none')
ax.spines['top'].set_color('none')

ax.xaxis.set_ticks_position('bottom')
ax.yaxis.set_ticks_position('left')

ax.spines['bottom'].set_position(('data',0))
ax.spines['left'].set_position(('data',0))
plt.plot(x,y,label='Tanh',linestyle='-',color='green')
plt.legend(['Tanh'])
plt.savefig('Tanh.png',dpi=500) # 指定分辨率