以下用sns作为seaborn的别名
1.seaborn整体布局设置
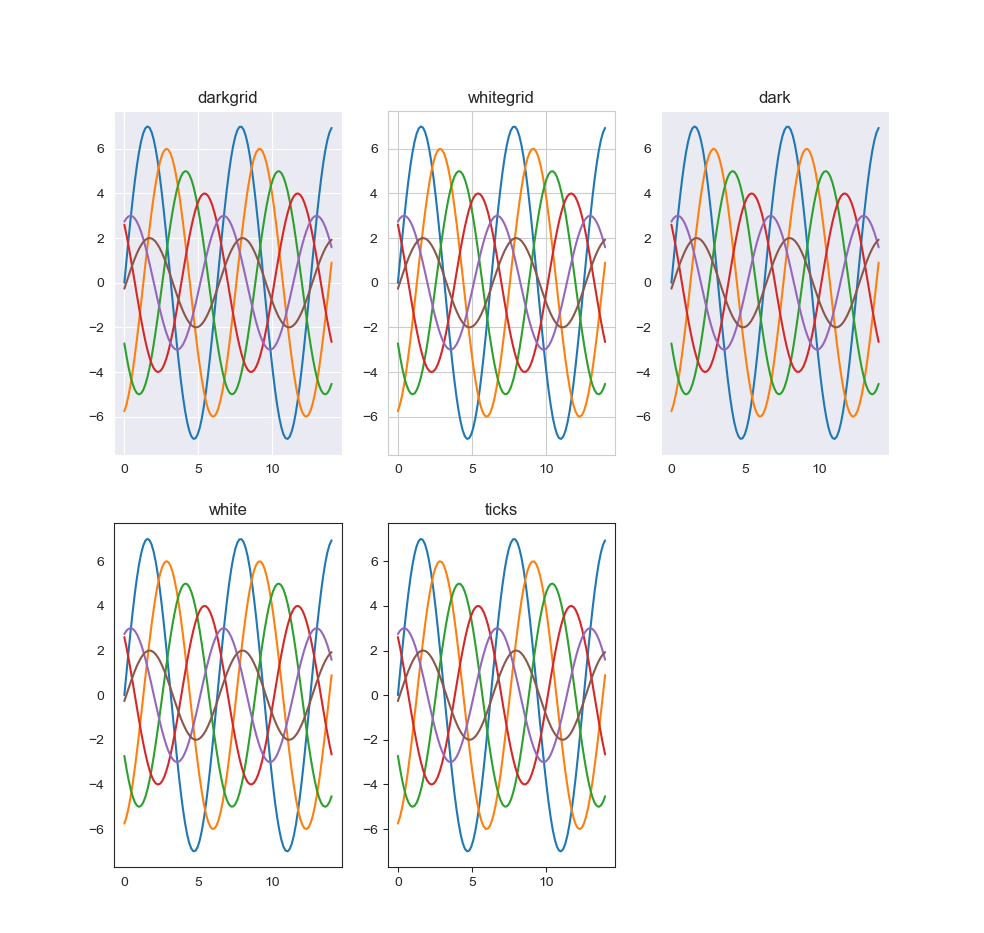
sns.set_syle()函数设置图的风格,传入的参数可以是"darkgrid", "whitegrid", "dark", "white", "ticks", 分别代表五种风格。sns.despine()可以去掉右边和上面的边线。
下面的代码画出五种风格的图
 1 import seaborn as sns
 2 import numpy as np
 3 import matplotlib as mpl
 4 import matplotlib.pyplot as plt
 5
 6
 7 def sinplot(ax):
 8     x = np.linspace(0, 14, 100)
 9     for i in range(6):
10         y = np.sin(x+i*5)*(7-i)
11         ax.plot(x, y)
12
13
14 style = ["darkgrid", "whitegrid", "dark", "white", "ticks"]
15 print(style[0])
16
17 plt.figure(figsize=(10, 10))
18 for i in range(5):
19     sns.set_style(style[i])   #设置样式一定要在子图的定义之前!!!!!!!
20     ax = plt.subplot(2, 3, i+1)
21     ax.set_title(style[i])
22     sinplot(ax)
23
24 plt.show()
运行结果如下

2.关于seaborn设置样式是针对哪个图形区(subplot)的问题
下面是我做的一个实验性的代码
 1 import seaborn as sns
 2 import numpy as np
 3 import matplotlib as mpl
 4 import matplotlib.pyplot as plt
 5
 6
 7 fig = plt.figure(figsize=(18,10))
 8 x = np.linspace(0, 6*np.pi, 100)
 9 y = np.sin(x)
10 ax_sin = plt.subplot(1, 2, 1)
11 sns.set()               #根据就近原则,这里的set操作是针对最近未定义的图形区ax_cos的
12 sns.despine(offset=100)     #根据就近原则,这里的despine操作是针对最近定义的图形区ax_cos的
13 plt.plot(x, y)             #根据就近原则,这里的plot操作是针对最近定义的图形区ax_sin的
14 z = np.cos(x)
15 ax_cos = plt.subplot(1, 2, 2)
16 plt.plot(x, z)  #根据就近原则,这里的plot操作是针对最近定义的图形区ax_cos的
17 plt.show()
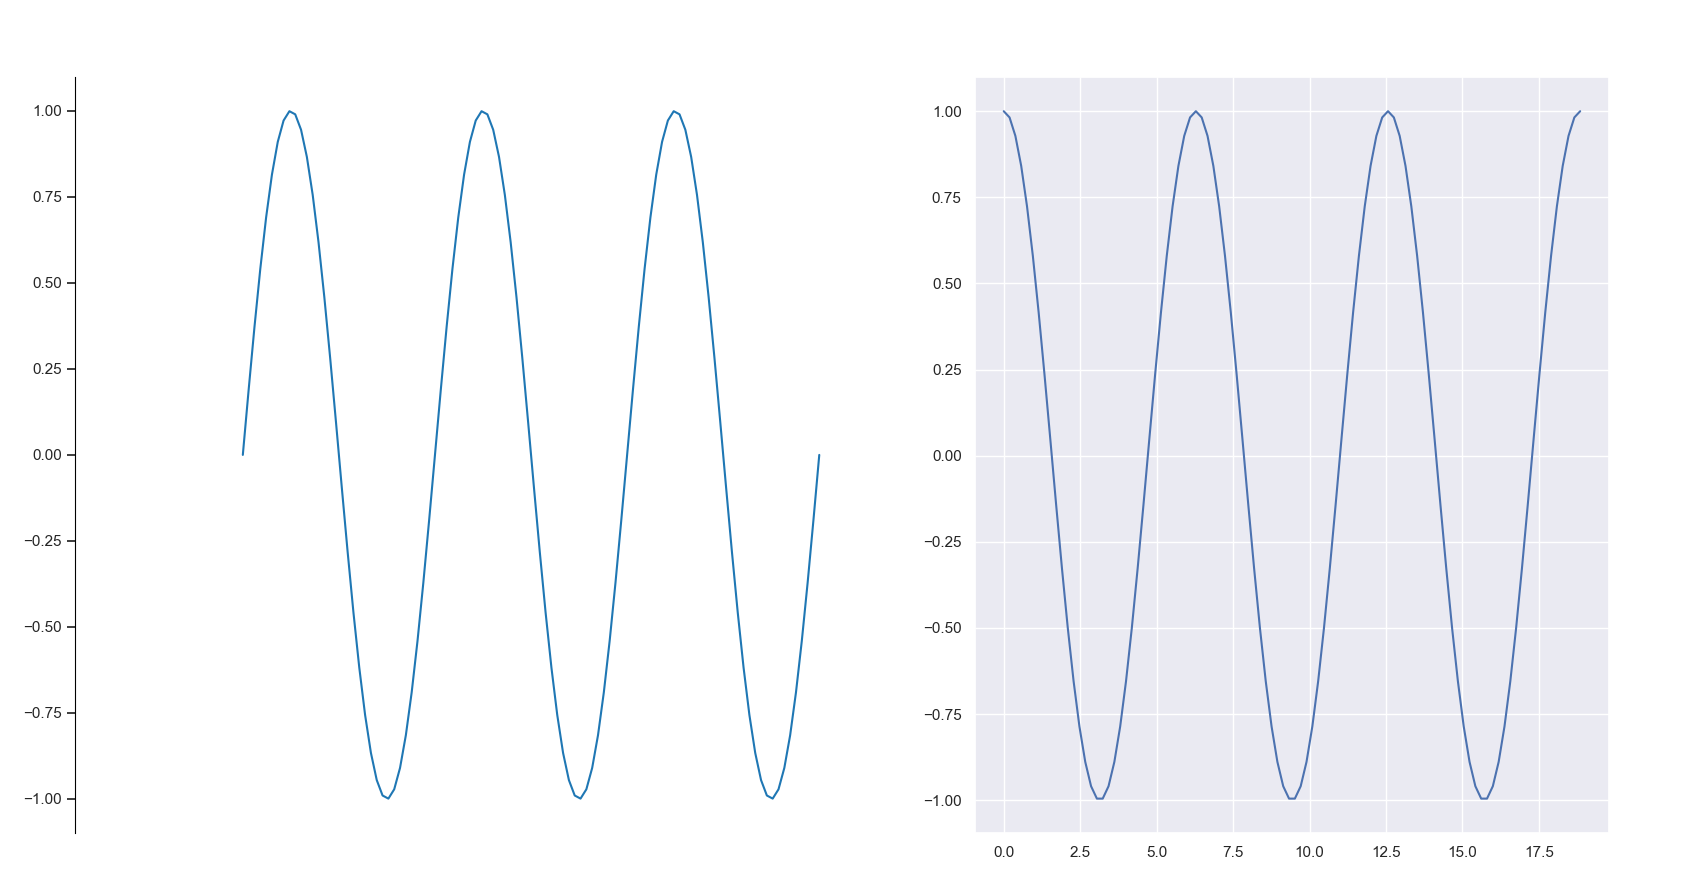
运行结果如下,根据运行结果可以推测,seaborn的despine操作和pyplot的plot操作都是在最近已经定义的图形区上,例如代码12,13行是在ax_sin上操作的,而11行的set是在即将定义的图形区上操作,
即ax_cos上操作。至于为什么会有这个规律以及有没有相关总结,关于哪些操作是在最近已经定义的图形区上还是在即将定义的图形区上进行暂时我还不清楚,希望有大神能指点一下。

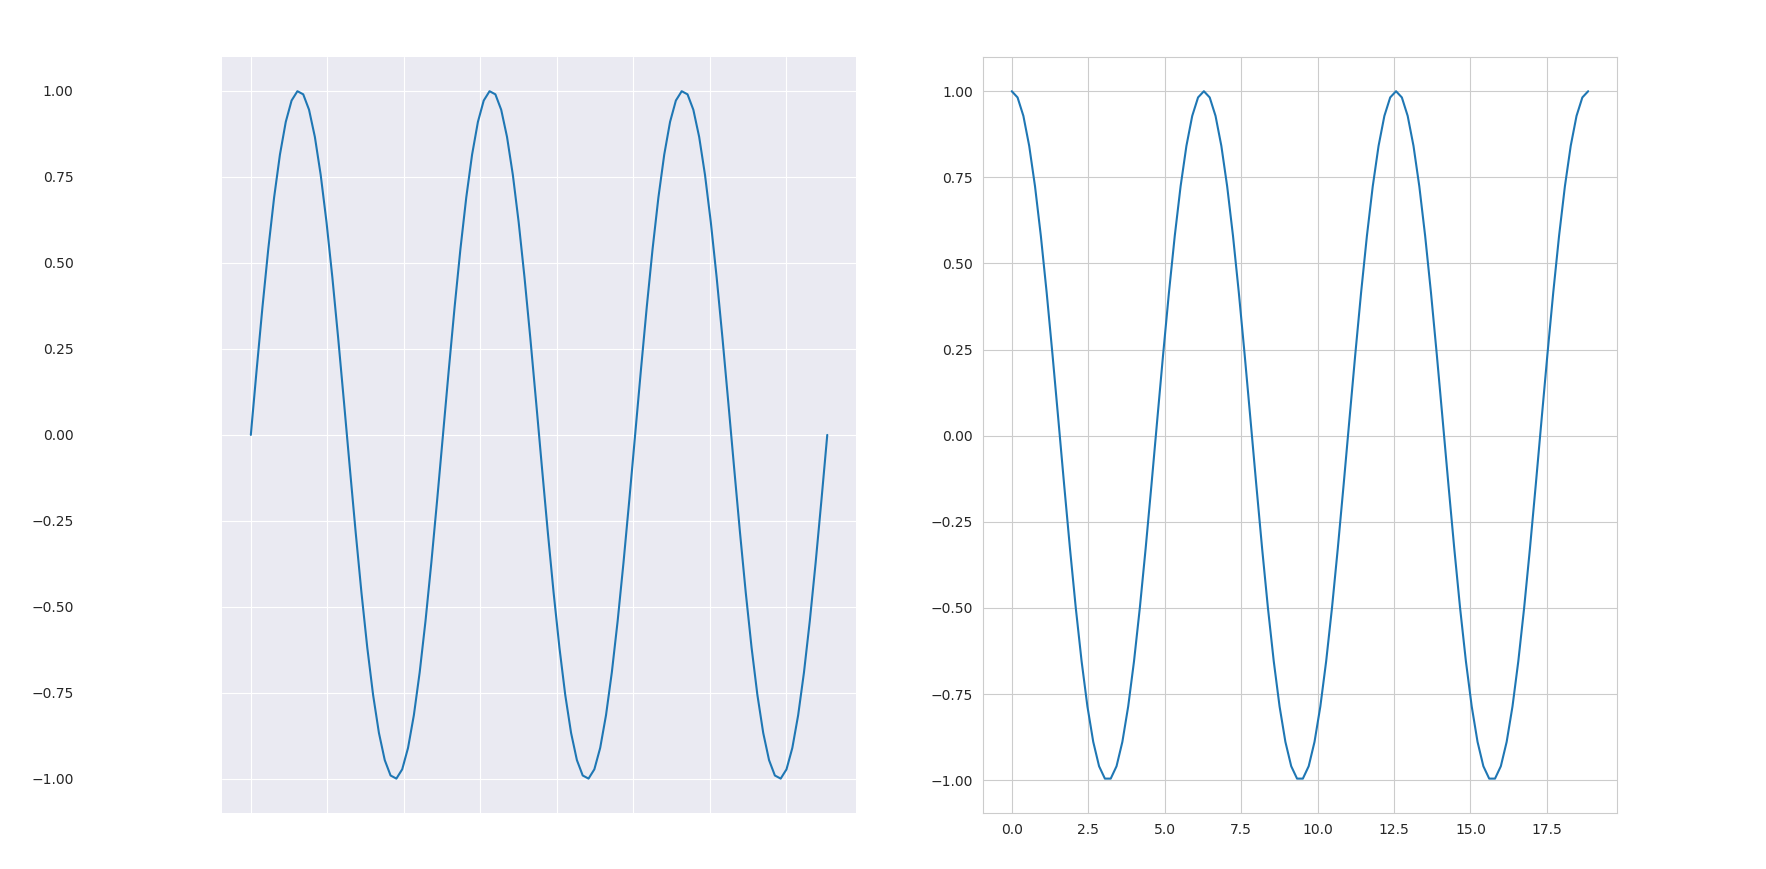
3.上面的问题可以用with语句解决了嘻嘻
放代码
 1 import seaborn as sns
 2 import numpy as np
 3 import matplotlib as mpl
 4 import matplotlib.pyplot as plt
 5
 6
 7 fig = plt.figure(figsize=(18,10))
 8 x = np.linspace(0, 6*np.pi, 100)
 9 y = np.sin(x)
10 with sns.axes_style("darkgrid"):
11     ax_sin = plt.subplot(1, 2, 1)
12     sns.despine(offset=100)     #根据就近原则,这里的despine操作是针对最近定义的图形区ax_cos的
13     plt.plot(x, y)             #根据就近原则,这里的plot操作是针对最近定义的图形区ax_sin的
14 with sns.axes_style("whitegrid"):
15     z = np.cos(x)
16     ax_cos = plt.subplot(1, 2, 2)
17     plt.plot(x, z)  #根据就近原则,这里的plot操作是针对最近定义的图形区ax_cos的
18 plt.show()
运行结果如下

4.set_context()函数,可以传四个参数"paper", "talk", "notebook", "poster",用于设置坐标轴风格
5.后面偷懒不记了,感觉这个以后用的不多,关于该课程的知识点这个简书链接可以看到: