1、测试数据下载
链接:https://pan.baidu.com/s/1EfffExvtxZYI1QLuxUZQ_g
提取码:5wfe
数据为plink 格式数据test.map、test.ped ;

一共包含三个品种,DOR、GMM、SUN各20个样本。
2、下载、安装detectRUNS包
install.packages("detectRUNS")
library(detectRUNS)
3、定义测试数据路径
genotypeFilePath <- ("test.ped")
mapFilePath <- ("test.map")
4、利用默认参数进行ROH检测
slidingRuns <- slidingRUNS.run(
genotypeFile = genotypeFilePath,
mapFile = mapFilePath,
windowSize = 15, threshold = 0.05,
minSNP = 20, ROHet = FALSE,
maxOppWindow = 1,
maxMissWindow = 1,
maxGap = 10^6,
minLengthBps = 250000,
minDensity = 1/10^3,
# SNP/kbps maxOppRun = NULL, maxMissRun = NULL)
以上是默认参数,实际分析需要调整,这个最关键!
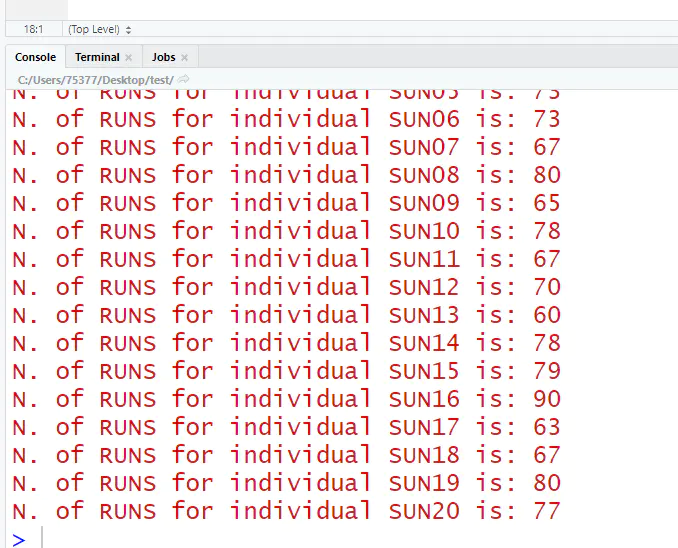
检测结果,每个个体检测的ROH数目:


5、生成统计列表
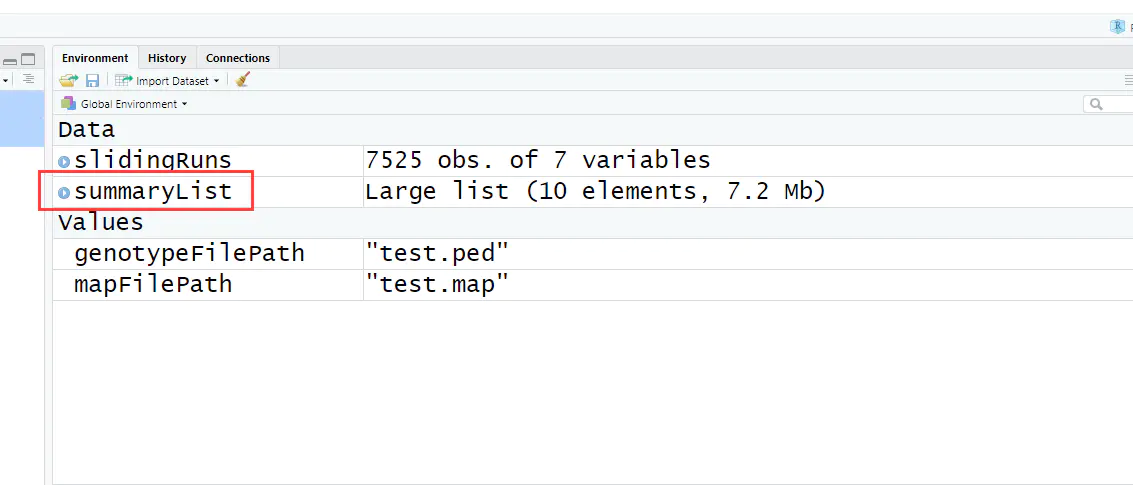
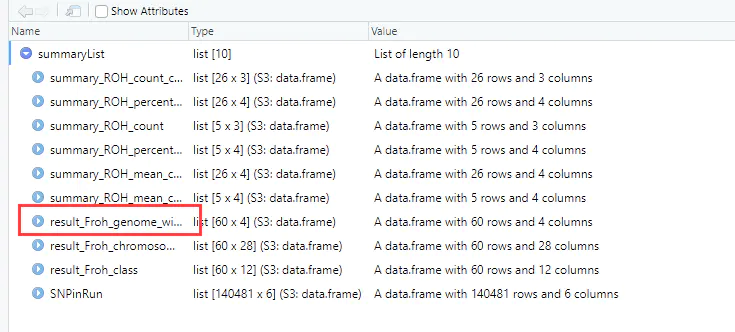
summaryList <- summaryRuns( runs = slidingRuns, mapFile = mapFilePath, genotypeFile = genotypeFilePath, Class = 6, snpInRuns = TRUE)

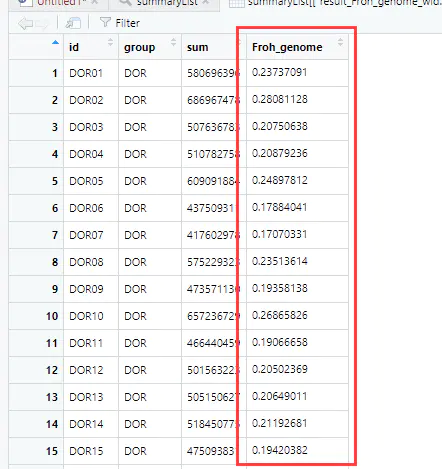
6、基于ROH近交系数如下:


参考:http://127.0.0.1:27306/library/detectRUNS/doc/detectRUNS.vignette.html