代码:
%% ------------------------------------------------------------------------
%%            Output Info about this m-file
fprintf('
***********************************************************
');
fprintf('        <DSP using MATLAB> Exameple 9.4

');

time_stamp = datestr(now, 31);
[wkd1, wkd2] = weekday(today, 'long');
fprintf('      Now is %20s, and it is %7s

', time_stamp, wkd2);
%% ------------------------------------------------------------------------

n = 0:256; k1 = 64; k2 = k1+32; m = 0:(k2-k1);


%% -----------------------------------------------------------------
%%                             Plot
%% -----------------------------------------------------------------
Hf1 = figure('units', 'inches', 'position', [1, 1, 8, 6], ...
	'paperunits', 'inches', 'paperposition', [0, 0, 6, 4], ...
	'NumberTitle', 'off', 'Name', 'Exameple 9.4');
set(gcf,'Color','white');

TF = 10;
% (a) Original signal
x = cos(pi*n); subplot(2, 2, 1);
Ha = stem(m, x(m+k1+1), 'g', 'filled'); axis([-1, 33, -1.1, 1.1]); grid on;
set(Ha, 'markersize', 2); xlabel('n'); ylabel('Amplitude');
title('Original Sequence x(n)', 'fontsize', TF);
set(gca, 'xtick', [0, 16, 32]);
set(gca, 'ytick', [-1, 0, 1]);

% (b) Interpolation by D = 2
I = 2; y = interp(x, I); subplot(2, 2, 2);
Hb = stem(m, y(m+k1*I+1), 'c', 'filled'); axis([-1, 33, -1.1, 1.1]); grid on;
set(Hb, 'markersize', 2); xlabel('n'); ylabel('Amplitude');
title('Interpolated by I = 2', 'fontsize', TF);
set(gca, 'xtick', [0, 16, 32]);
set(gca, 'ytick', [-1, 0, 1]);

% (c) Interpolation by I = 4
I = 4; y = interp(x, I); subplot(2, 2, 3);
Hc = stem(m, y(m+k1*I+1), 'r', 'filled'); axis([-1, 33, -1.1, 1.1]); grid on;
set(Hc, 'markersize', 2); xlabel('n'); ylabel('Amplitude');
title('Interpolated by I = 4', 'fontsize', TF);
set(gca, 'xtick', [0, 16, 32]);
set(gca, 'ytick', [-1, 0, 1]);

% (d) Interpolation by I = 8
I = 8; y = interp(x, I); subplot(2, 2, 4);
Hd = stem(m, y(m+k1*I+1), 'm', 'filled'); axis([-1, 33, -1.1, 1.1]); grid on;
set(Hd, 'markersize', 2); xlabel('n'); ylabel('Amplitude');
title('Interpolated by I = 8', 'fontsize', TF);
set(gca, 'xtick', [0, 16, 32]);
set(gca, 'ytick', [-1, 0, 1]);
运行结果:
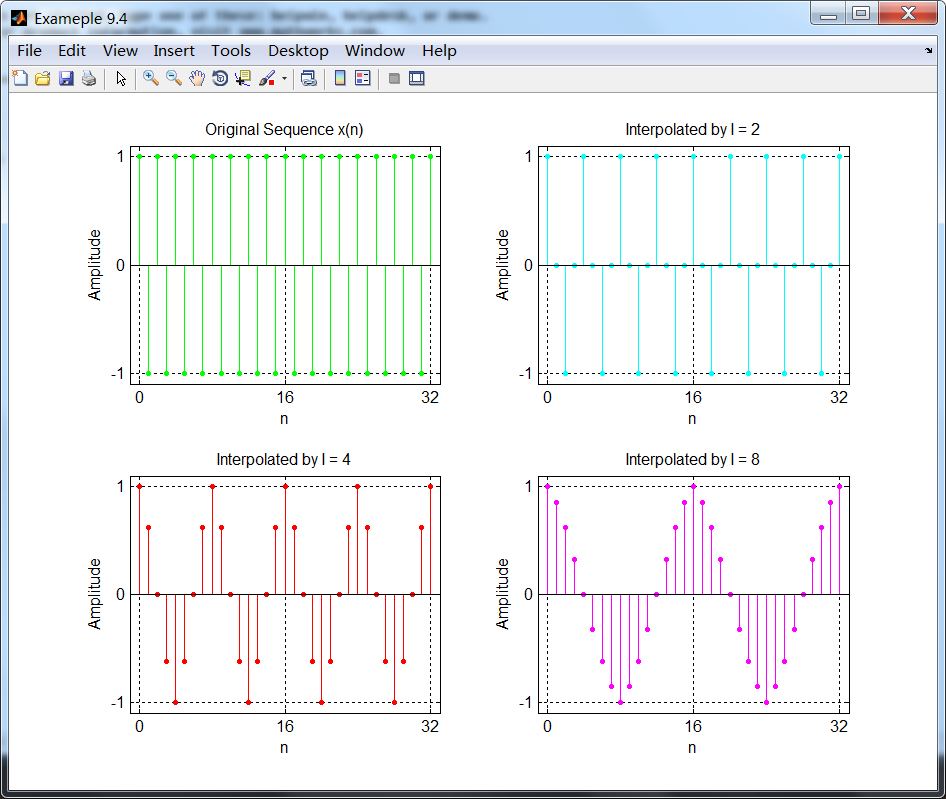
从图看,I的所有三个数值下的插值序列是合适的,在更高的采样率上展示了原始正弦信号x(n)。I=8的例子里,
插值序列从形状上看不像是精确的正弦信号。这可能是由于低通滤波器和理想低通滤波器有差距而造成的。