背景:java开发的过程中,需要对数据进行可视化,这样方便客户理解此时的数据状态
语言:java,js,window7,echarts包文件
sample的例子下面的参照
https://www.echartsjs.com/examples/en/editor.html?c=line-sections
html
<!DOCTYPE html>
<html lang="en" xmlns:th="http://www.thymeleaf.org">
<head>
<meta name="viewport" charset="UTF-8"
	content="target-densitydpi=device-dpi, width=device-width, initial-scale=1, user-scalable=no, minimum-scale=1.0, maximum-scale=1.0" />
<title></title>
<meta name="viewport"
	content="width=device-width, initial-scale=1, minimum-scale=1, maximum-scale=1" />
<script th:src="@{jquery/js/jquery-3.2.0.min.js}" type="text/javascript"></script>
<script th:src="@{echarts/js/echarts.js}" type="text/javascript"></script>
<script th:src="@{js/testCharts.js}" type="text/javascript"></script>

</head>
<body>
	<div id="conditions">

		<table>
			<tr>
				<td><label>検索条件:</label></td>
				<td><input type="radio" name="month" id="month"
					onclick="choseMonthOrDay(this)" /><label>月</label>
				</td>
				<td><input type="radio" name="month" id="month"
					onclick="choseMonthOrDay(this)" /><label>年</label>
				</td>
				<td><input type="button" onclick="beforRet()"
					style="background-color: #3987e4;  83px; height: 44px; border: 0;"
					value="戻る"></input></td>
			</tr>
		</table>
	</div>

	<div id="chart"></div>
	<!-- 	<div id="chart"></div> -->
</body>
</html>
js
$(document).ready(function() {

//	$("#conditions").css("height", $(window).height()*0.1);
//	$("#conditions").css("background-color", "#000000");
//	alert($(window).width())
	$("#chart").css("height", $(window).height()*0.8);
	window.onresize = function() {
//		$("#chart").css("height", $(window).height()*0.1);
		$("#conditions").css("height", $(window).height()*0.8);
	}

	var dataList
	$.ajax({
		url : "/testCharts/selectData",
		type : 'post',
		data : {
			"habitSeq" : "2",
			"value" : "01"
		},
		cache : false,
		async : true,
		success : function(data) {
			dataList = JSON.parse(data);
			chartsDisplay(dataList)
		}
	});
})

function chartsDisplay(dataList) {

	if (dataList.length != 0) {
		var xAxisList = new Array();
		var yAxisList = new Array();
		for (var i = 0; i < dataList.length; i++) {
			xAxisList[i] = (dataList[i]["maxInsDateTime"]);
			yAxisList[i] = (dataList[i]["totalPrice"]);
		}
		var echart = echarts.init(document.getElementById('chart'));
		var option = {
			baseOption : {
				title : {
					text : '店舗売上状況',
					subtext : '売上分析'
				},
				legend : {
					data : [ '当月売上', '金額' ]
				},
				xAxis : {
					data : xAxisList
				// [ '周一', '周二', '周三', '周四', '周五', '周六', '周日' ]
				},
				yAxis : {

				},
				tooltip : {
					show : true,
					formatter : '売上:{a}<br />日付:{b}<br />値:{c}'
				},
				series : [ {
					name : '当月売上',
					type : 'bar',
					data : yAxisList ,// [ 200, 312, 431, 241, 175, 275,
											// 369
					// ],
					markPoint : {
						data : [ {
							type : 'max',
							name : '最大値'
						}, {
							type : 'min',
							name : '最小値'
						} ]
					},
					markLine : {
						data : [ {
							type : 'average',
							name : '平均値',
							itemStyle : {
								normal : {
									color : 'green'
								}
							}
						} ]
					}
				}, {
					name : '金額',
					type : 'line',
					data :  yAxisList , // [ 321, 432, 543, 376, 286, 298,
											// 400
					// ],
					markPoint : {
						data : [ {
							type : 'max',
							name : '最大値'
						}, {
							type : 'min',
							name : '最小値'
						} ]
					},
					markLine : {
						data : [ {
							type : 'average',
							name : '平均値',
							itemStyle : {
								normal : {
									color : 'blue'
								}
							}
						} ]
					}
				} ]
			},
			media : [ {
				// 小与1000像素时候响应
				query : {
					maxWidth : 1000
				},
				option : {
					title : {
						show : true,
						text : '测试一下'
					}
				}
			} ]
		};
		// 每次窗口大小改变的时候都会触发onresize事件,这个时候我们将echarts对象的尺寸赋值给窗口的大小这个属性,从而实现图表对象与窗口对象的尺寸一致的情况
		window.onresize = echart.resize*0.8;
		echart.setOption(option);
	}

}
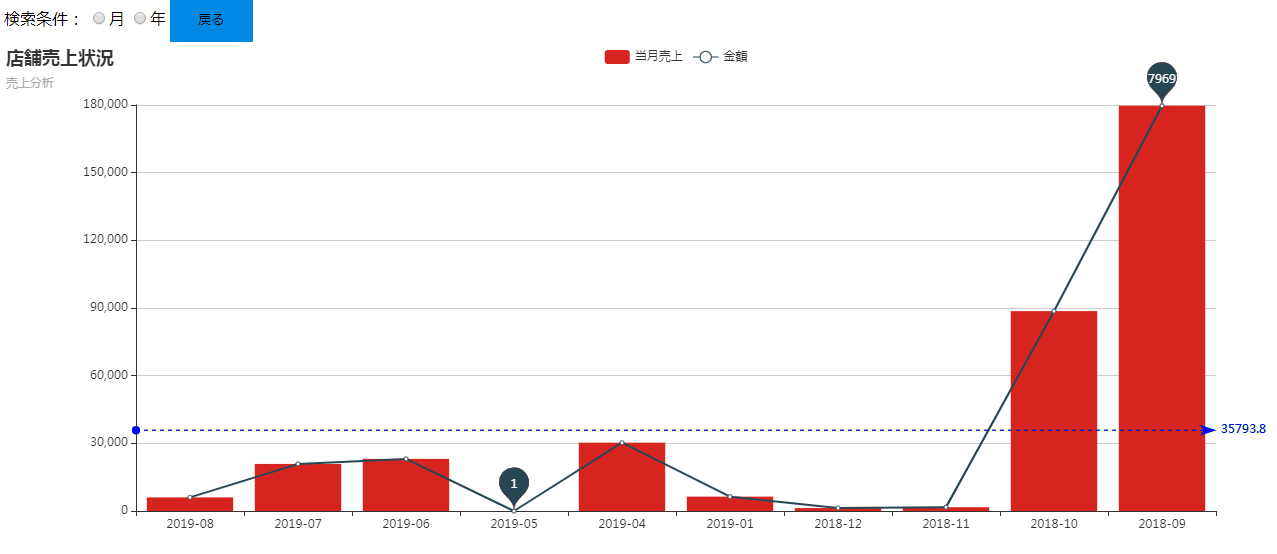
效果:
’