简介
Elasticsearch
Elasticsearch是一个实时的分布式搜索分析引擎, 它能让你以一个之前从未有过的速度和规模,去探索你的数据。它被用作全文检索、结构化搜索、分析以及这三个功能的组合。支持集群配置。
Logstash/Filebeats
Logstash是一款强大的数据处理工具,它可以实现数据传输,格式处理,格式化输出,还有强大的插件功能,常用于日志处理。。
Kibana
kibana是一个开源和免费的工具,它可以为Logstash和ElasticSearch提供的日志分析友好的Web界面,可以帮助您汇总、分析和搜索重要数据日志。
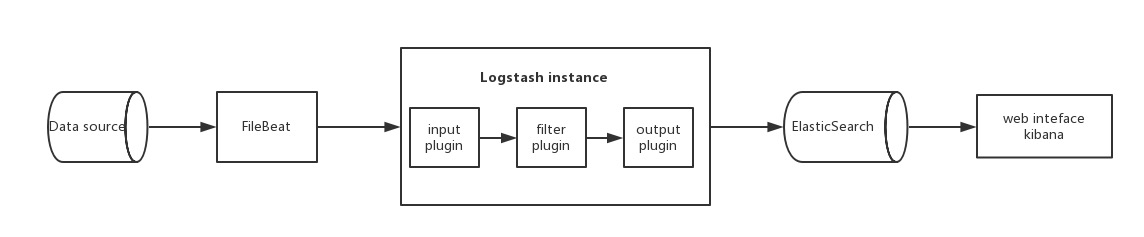
架构流程
安装配置
版本
-
Elasticsearch
-
Logstash
-
Kibana
-
Filebeats
先决条件
-
java8
-
mac软件管理工具 brew
brew
    # 安装软件

    brew install your-software

    # 查看软件安装信息

    brew info your-software
    # 管理服务,没怎么用它,ELK都有自己的启动脚本在安装目录的bin/下面,且基本上都会携带参数启动
    brew services start/stop your-service
Elasticsearch
mac安装elasticsearch
    #mac安装elasticsearch
    brew install elasticsearch
elasticsearch的相关安装位置
    安装目录:/usr/local/Cellar/elasticsearch/{elasticsearch-version}/
    日志目录:/usr/local/var/log/elasticsearch/

    插件目录:/usr/local/var/elasticsearch/plugins/

    配置目录:/usr/local/etc/elasticsearch/
启动
    brew services start elasticsearch
    首次启动,默认的端口号是9200,用户名是elastic,密码我也不知道(资料上查到的都是6.0以前的版本,密码是changeme,6.0以后不清楚),通过调用_xpack接口修改默认密码:
版本
    elasticsearch --version
    Version: 6.6.1, Build: oss/tar/1fd8f69/2019-02-13T17:10:04.160291Z, JVM: 1.8.0_131
Kibana
mac安装kibana
brew install kibana
安装位置
    安装目录:/usr/local/Cellar/kibana/{kibana-version}/
    配置目录:/usr/local/etc/kibana/
备注
启动kibana之前,需要先修改一下配置文件/usr/local/etc/kibana/kibana.yml,取消elasticsearch.name和elasticsearch.password的注释,并将值改为上面修改过的用户名密码username: elastic, password: 123456,请参考下面的kibana.yml片段
# kibana.yml

# If your Elasticsearch is protected with basic authentication, these settings provide
# the username and password that the Kibana server uses to perform maintenance on the Kibana
# index at startup. Your Kibana users still need to authenticate with Elasticsearch, which
# is proxied through the Kibana server.
elasticsearch.username: "elastic"
elasticsearch.password: "changeme"
启动
brew services start kibana
首次启动,默认端口号是5601,打开浏览器访问http://localhost:5601访问kibana管理页面,会弹框要求输入用户名密码,输入elastic和123456即可。
注:这里的kibana.yml中配置的用户名密码是kibana访问elasticsearch需要用到的,而web页面手动输入的用户名密码是我们登录kibana管理页面的密码,它们为什么能共用一个密码,不太清楚。
版本
   kibana  --version
   6.6.1
Logstash
mac安装logstash
brew install logstash
logstash的相关安装位置
安装目录:/usr/local/Cellar/logstash/{logstash-version}/
配置目录:/usr/local/etc/logstash
配置
vim ./first-pipeline.conf
- 支持Filebeat作为输入源
# Sample Logstash configuration for creating a simple
# Beats -> Logstash -> Elasticsearch pipeline.
input {
  beats {
    host =>"127.0.0.1"
    port => "5044"
  }
}

output {
  elasticsearch {
    hosts => ["http://localhost:9200"]
    index => "%{[@metadata][beat]}-%{[@metadata][version]}-%{+YYYY.MM.dd}"
    #user => "elastic"
    #password => "changeme"
  }
}
- logstash 配置文件输入支持文件输入,例如:
[root@access-1 logstash-7.2.1]# cat logstash_809.conf
input {
    file{
        path => ['/opt/access-server-1.0.5/log/akka-gb809.log'] #读取日志文件路径
 type => "akka-gb809" #一个标签
 stat_interval => "2" #每隔几秒读取日志文件,默认为1秒
    }
    file{
 path => ['/opt/access-server-1.0.5/log/akka-gb808.log']
 type => "akka-gb808"
 stat_interval => "2"
    }
    file{
 path => ['/opt/access-server-1.0.5/log/akka.log']
 type => "akka"
 stat_interval => "2"
    }
    file{
 path => ['/opt/access-server-1.0.5/log/all_error.log']
 type => "all_error"
 stat_interval => "2"
 codec => multiline { #将换行的日志打印出来
  pattern => "(^d{2}:d{2}:d{2}.d{3})UTC" #匹配的正则
  negate => true
  what => "previous"
 }

    }

}

filter {
      date {
         match => [ "timestamp" , "yyyy-MM-dd HH:mm:ss.SSS" ]
      }
}


output {
 if [type] == "akka-gb809" { #要匹配的日志文件标签
    elasticsearch {
       hosts => "192.168.108.151:9200" #es节点地址
       index => "access-1-akka-gb809" #生成的索引,用于kibana展示
     }
  }

 if [type] == "akka-gb808" {
    elasticsearch {
       hosts => "192.168.108.151:9200"
       index => "access-1-akka-gb808"
     }
  }
 if [type] == "akka" {
    elasticsearch {
       hosts => "192.168.108.151:9200"
       index => "access-1-akka"
     }
  }
 if [type] == "all_error" {
    elasticsearch {
       hosts => "192.168.108.151:9200"
       index => "access-1-all_error"
     }
  }
}
启动
logstash -e 'input { stdin { } } output { stdout {} }'
或
logstash -f config/first-pipeline.conf --config.test_and_exit
此条命令检验配置文件是否正确
logstash -f config/first-pipeline.conf --config.reload.automatic
此条命令是启动logstash,并且在first-pipeline.conf文件变更时自动重启。
后台启动
nohup logstash -f config/first-pipeline.conf --config.reload.automatic & > /dev/null
版本
logstash 6.6.1
Filebeats'
安装
#mac安装Filebeats'
brew install filebeat
位置
安装目录:/usr/local/Cellar/filebeat/{filebeat-version}/
配置目录:/usr/local/etc/filebeat/
缓存目录:/usr/local/var/lib/filebeat/
配置
vim /usr/local/etc/filebeat//filebeat.yml
###################### Filebeat Configuration Example #########################

# This file is an example configuration file highlighting only the most common
# options. The filebeat.reference.yml file from the same directory contains all the
# supported options with more comments. You can use it as a reference.
#
# You can find the full configuration reference here:
# https://www.elastic.co/guide/en/beats/filebeat/index.html

# For more available modules and options, please see the filebeat.reference.yml sample
# configuration file.

#=========================== Filebeat prospectors =============================

filebeat.prospectors:

# Each - is a prospector. Most options can be set at the prospector level, so
# you can use different prospectors for various configurations.
# Below are the prospector specific configurations.

- type: log

  # Change to true to enable this prospector configuration.
  enabled: true

  # Paths that should be crawled and fetched. Glob based paths.
  paths:
    - /apps/intelligent-family-console/intelligentFamilyConsole/*.log
    #- c:programdataelasticsearchlogs*

  # Exclude lines. A list of regular expressions to match. It drops the lines that are
  # matching any regular expression from the list.
  #exclude_lines: ['^DBG']

  # Include lines. A list of regular expressions to match. It exports the lines that are
  # matching any regular expression from the list.
  #include_lines: ['^ERR', '^WARN']

  # Exclude files. A list of regular expressions to match. Filebeat drops the files that
  # are matching any regular expression from the list. By default, no files are dropped.
  #exclude_files: ['.gz$']

  # Optional additional fields. These fields can be freely picked
  # to add additional information to the crawled log files for filtering
  #fields:
  # level: debug
  # review: 1

  ### Multiline options

  # Mutiline can be used for log messages spanning multiple lines. This is common
  # for Java Stack Traces or C-Line Continuation

  # The regexp Pattern that has to be matched. The example pattern matches all lines starting with [
  #multiline.pattern: ^[

  # Defines if the pattern set under pattern should be negated or not. Default is false.
  #multiline.negate: false

  # Match can be set to "after" or "before". It is used to define if lines should be append to a pattern
  # that was (not) matched before or after or as long as a pattern is not matched based on negate.
  # Note: After is the equivalent to previous and before is the equivalent to to next in Logstash
  #multiline.match: after


#============================= Filebeat modules ===============================

filebeat.config.modules:
  # Glob pattern for configuration loading
  path: ${path.config}/modules.d/*.yml

  # Set to true to enable config reloading
  reload.enabled: false

  # Period on which files under path should be checked for changes
  #reload.period: 10s

#==================== Elasticsearch template setting ==========================

setup.template.settings:
  index.number_of_shards: 3
  #index.codec: best_compression
  #_source.enabled: false

#================================ General =====================================

# The name of the shipper that publishes the network data. It can be used to group
# all the transactions sent by a single shipper in the web interface.
#name:

# The tags of the shipper are included in their own field with each
# transaction published.
#tags: ["service-X", "web-tier"]

# Optional fields that you can specify to add additional information to the
# output.
#fields:
# env: staging


#============================== Dashboards =====================================
# These settings control loading the sample dashboards to the Kibana index. Loading
# the dashboards is disabled by default and can be enabled either by setting the
# options here, or by using the `-setup` CLI flag or the `setup` command.
#setup.dashboards.enabled: false

# The URL from where to download the dashboards archive. By default this URL
# has a value which is computed based on the Beat name and version. For released
# versions, this URL points to the dashboard archive on the artifacts.elastic.co
# website.
#setup.dashboards.url:

#============================== Kibana =====================================

# Starting with Beats version 6.0.0, the dashboards are loaded via the Kibana API.
# This requires a Kibana endpoint configuration.
setup.kibana:

  # Kibana Host
  # Scheme and port can be left out and will be set to the default (http and 5601)
  # In case you specify and additional path, the scheme is required: http://localhost:5601/path
  # IPv6 addresses should always be defined as: https://[2001:db8::1]:5601
  #host: "localhost:5601"

#============================= Elastic Cloud ==================================

# These settings simplify using filebeat with the Elastic Cloud (https://cloud.elastic.co/).

# The cloud.id setting overwrites the `output.elasticsearch.hosts` and
# `setup.kibana.host` options.
# You can find the `cloud.id` in the Elastic Cloud web UI.
#cloud.id:

# The cloud.auth setting overwrites the `output.elasticsearch.username` and
# `output.elasticsearch.password` settings. The format is `<user>:<pass>`.
#cloud.auth:

#================================ Outputs =====================================

# Configure what output to use when sending the data collected by the beat.

#-------------------------- Elasticsearch output ------------------------------
#output.elasticsearch:
  # Array of hosts to connect to.
  #hosts: ["localhost:9200"]

  # Optional protocol and basic auth credentials.
  #protocol: "https"
  #username: "elastic"
  #password: "changeme"

#----------------------------- Logstash output --------------------------------
output.logstash:
  # The Logstash hosts
  hosts: ["localhost:5044"]

  # Optional SSL. By default is off.
  # List of root certificates for HTTPS server verifications
  #ssl.certificate_authorities: ["/etc/pki/root/ca.pem"]

  # Certificate for SSL client authentication
  #ssl.certificate: "/etc/pki/client/cert.pem"

  # Client Certificate Key
  #ssl.key: "/etc/pki/client/cert.key"

#================================ Logging =====================================

# Sets log level. The default log level is info.
# Available log levels are: error, warning, info, debug
logging.level: debug

# At debug level, you can selectively enable logging only for some components.
# To enable all selectors use ["*"]. Examples of other selectors are "beat",
# "publish", "service".
#logging.selectors: ["*"]

#============================== Xpack Monitoring ===============================
# filebeat can export internal metrics to a central Elasticsearch monitoring
# cluster. This requires xpack monitoring to be enabled in Elasticsearch. The
# reporting is disabled by default.

# Set to true to enable the monitoring reporter.
#xpack.monitoring.enabled: false

# Uncomment to send the metrics to Elasticsearch. Most settings from the
# Elasticsearch output are accepted here as well. Any setting that is not set is
# automatically inherited from the Elasticsearch output configuration, so if you
# have the Elasticsearch output configured, you can simply uncomment the
# following line.
#xpack.monitoring.elasticsearch:
主要是配置filebeat.inputs,采集哪些日志;关闭output.elasticsearch,打开output.logstash,将收集到的信息推送到logstash。
启动
filebeat -e -c ./filebeat6.3.2/filebeat.yml
或
nohup filebeat -e -c ./filebeat6.3.2/filebeat.yml & >/dev/null
版本
filebeat --version
lag --version has been deprecated, version flag has been deprecated, use version subcommand
filebeat version 6.2.4 (amd64), libbeat 6.2.4
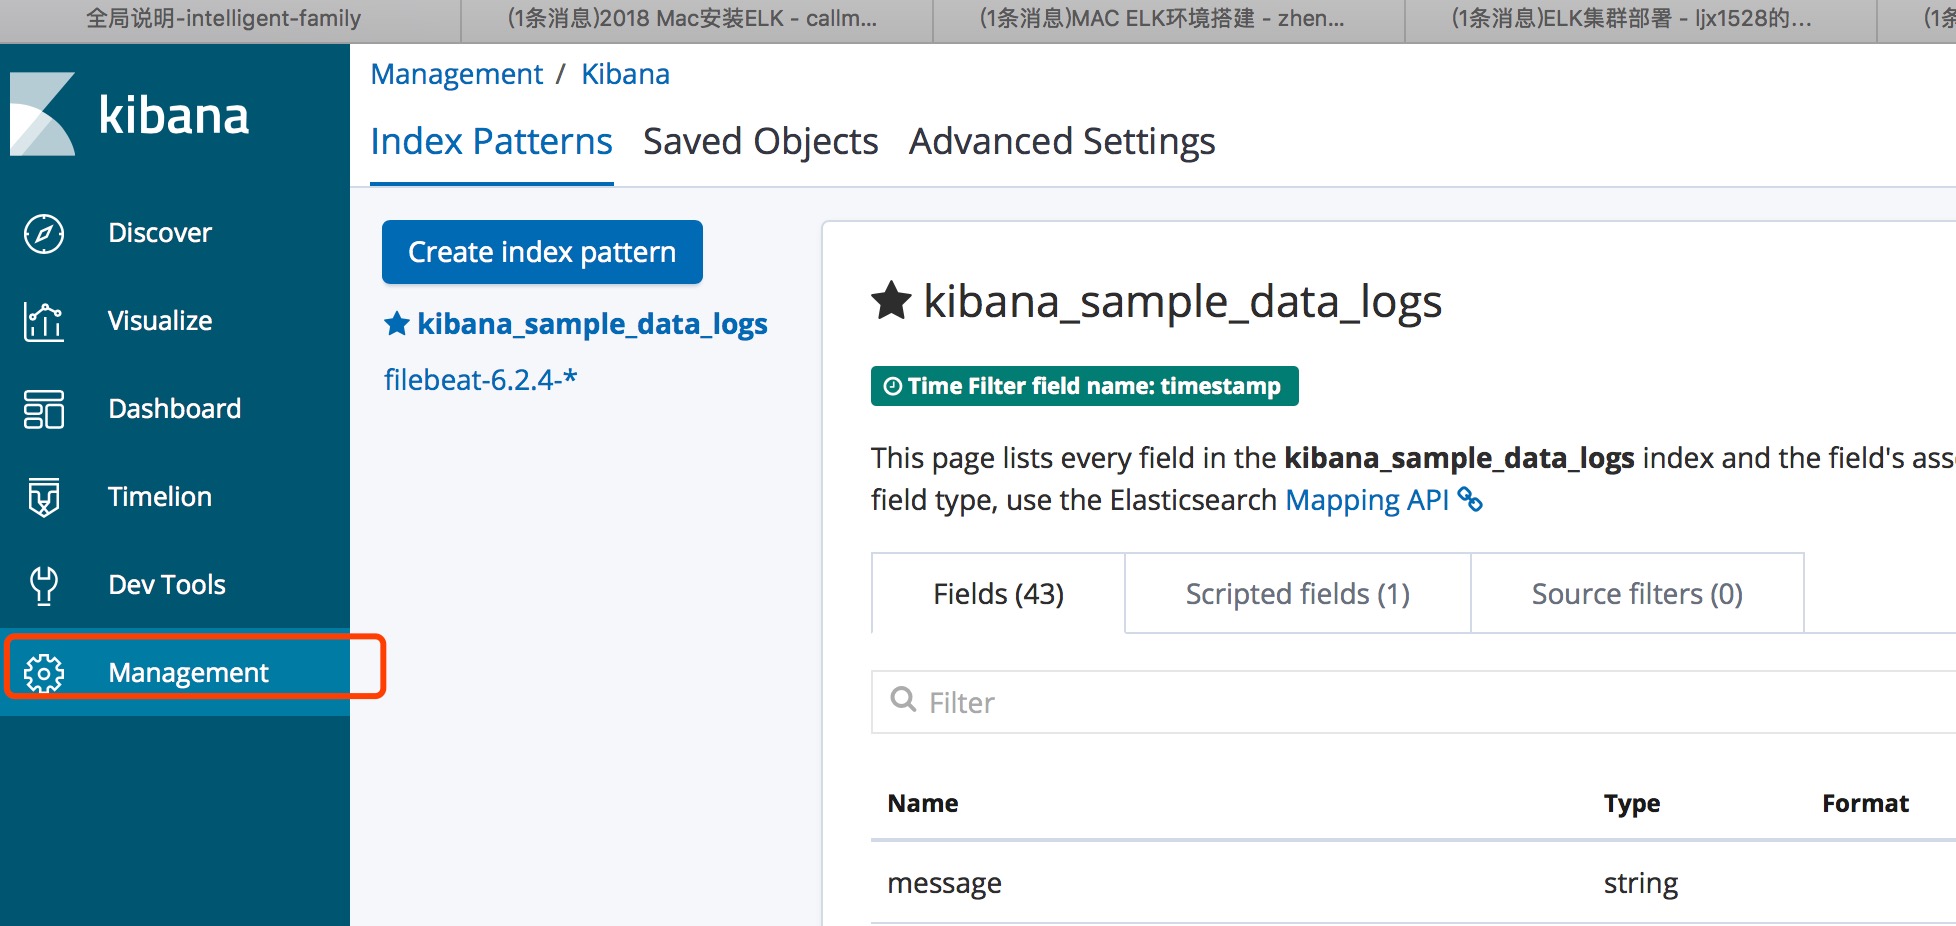
Kibana案例
创建Index patterns
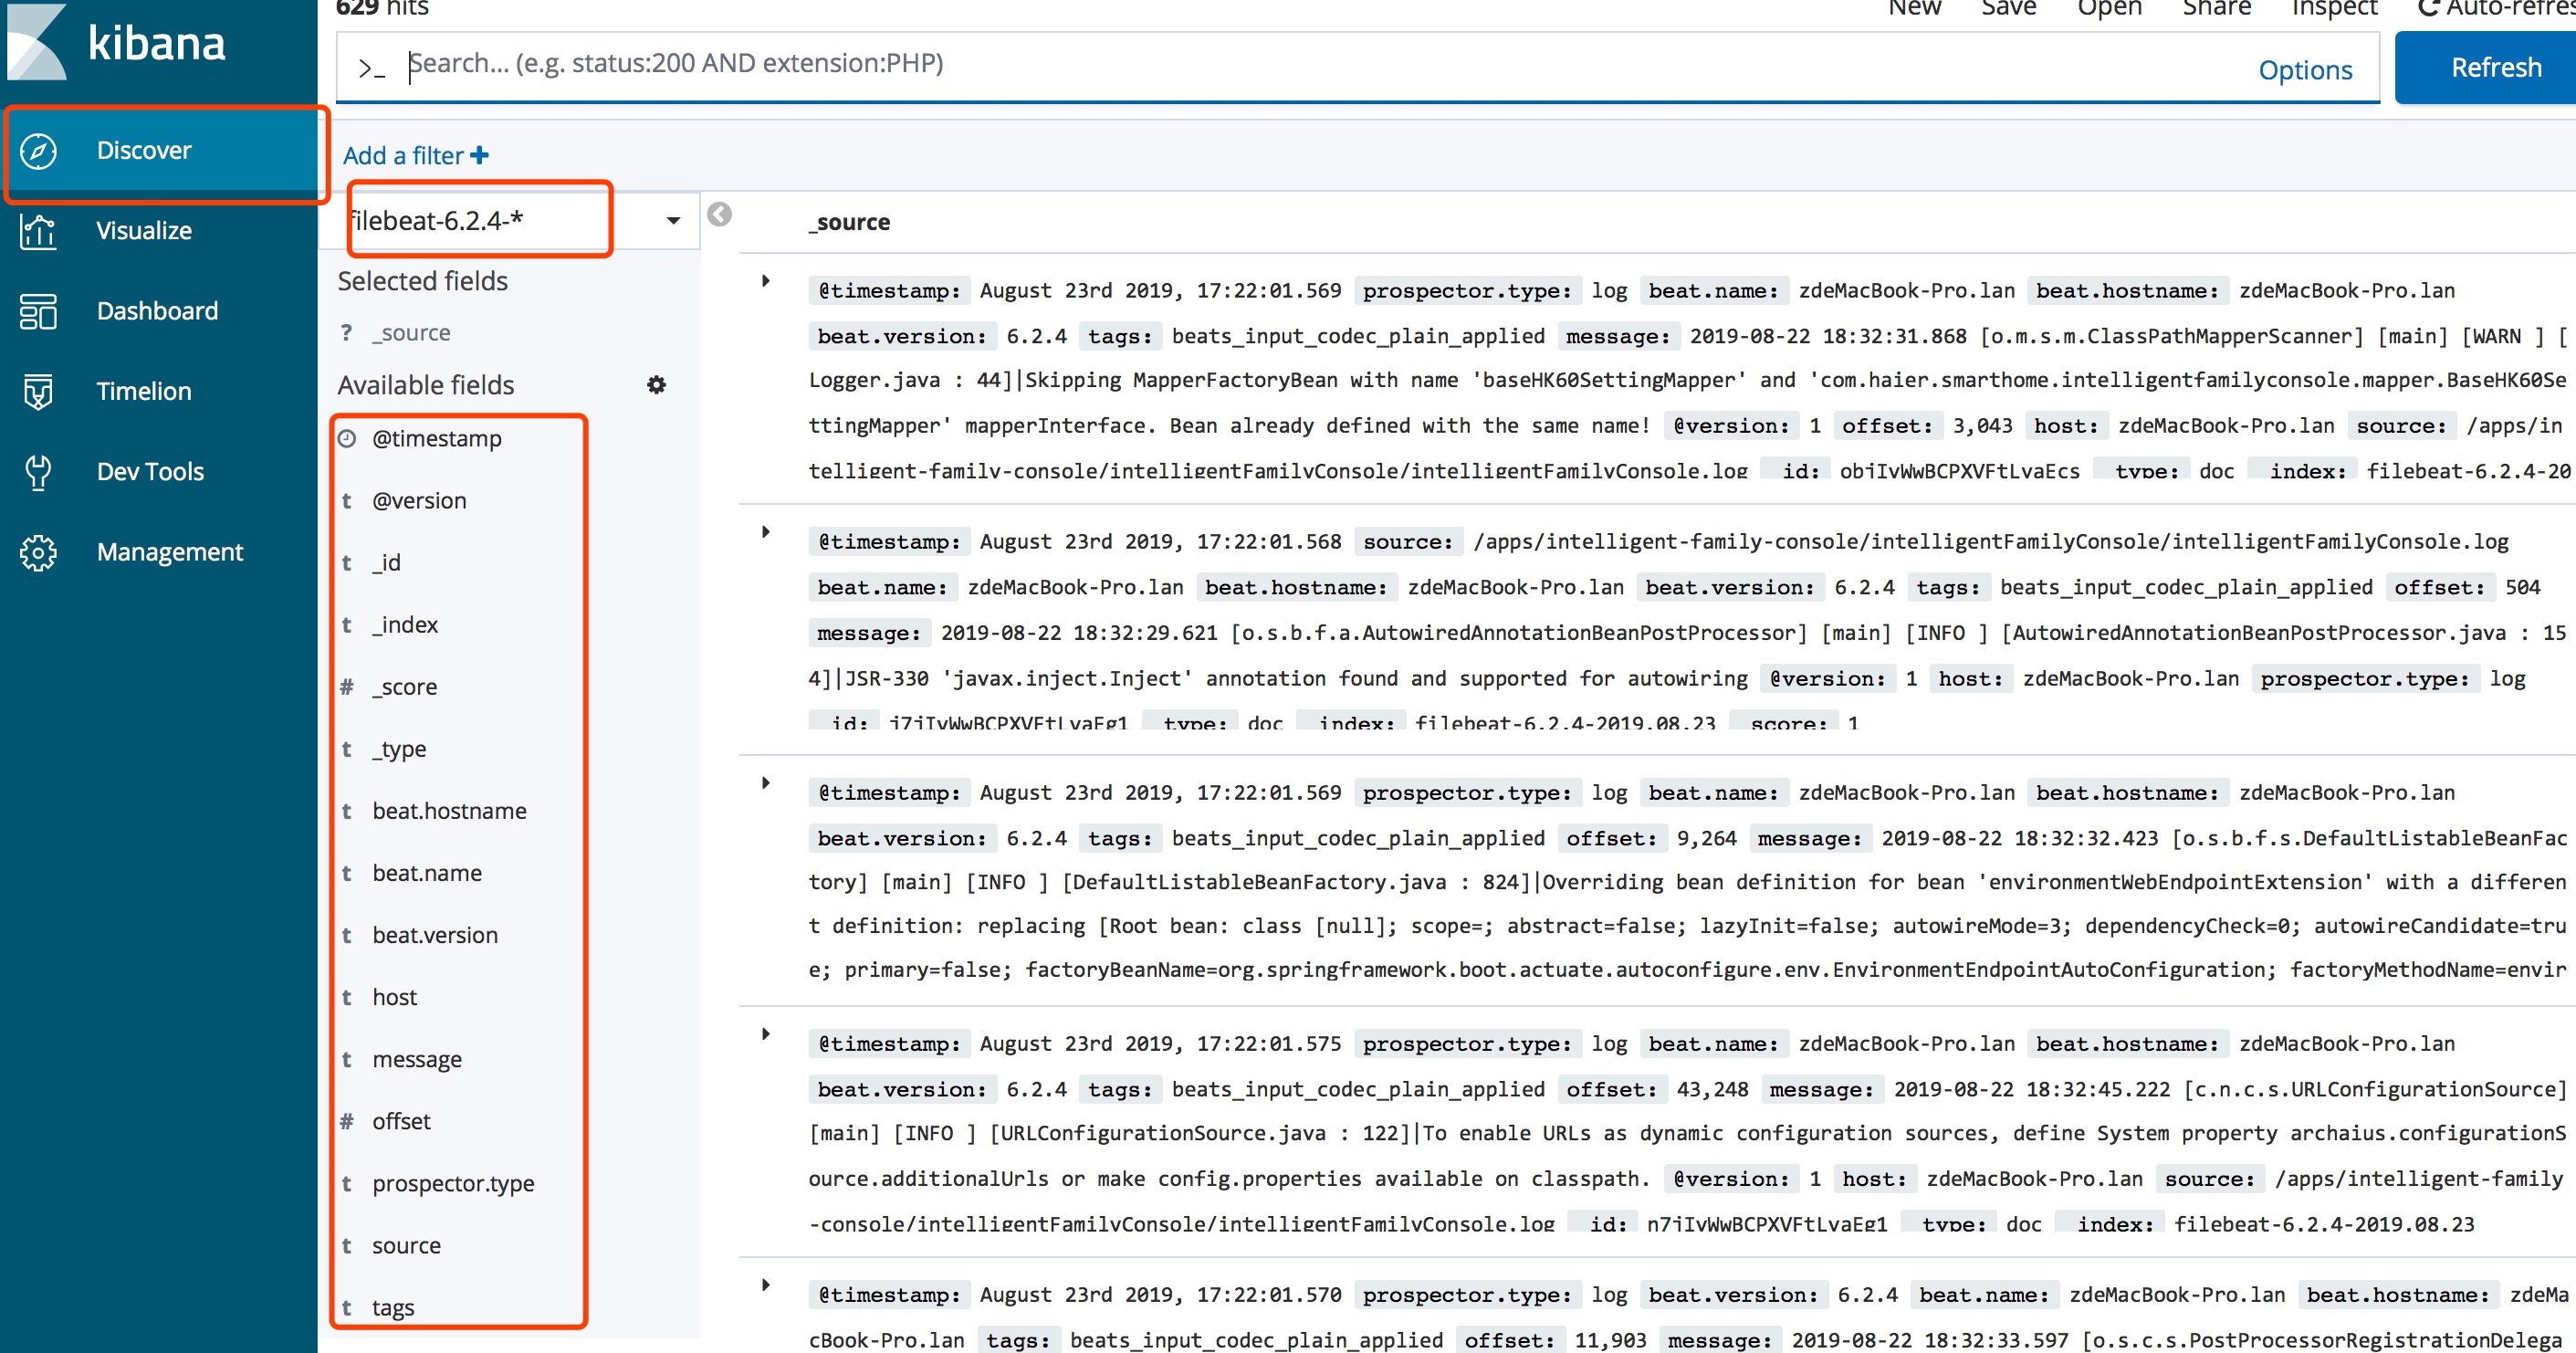
检索界面
- 左侧为可检索条件
后续跟进
日志定时删除问题
Elasticsearch集群部署
下载解压
wget https://artifacts.elastic.co/downloads/elasticsearch/elasticsearch-7.2.1-linux-x86_64.tar.gz

tar -zvxf elasticsearch-7.2.1-linux-x86_64.tar.gz -C /usr/local/elk
创建用户及授权
ElasticSerach要求以非root身份启动,在每个节点创建用户及用户组
[root@elk-1 ~]# groupadd elasticsearch

[root@elk-1 ~]# useradd elasticsearch -g elasticsearch
在每个节点上创建数据data和logs目录:
[root@elk-1 ~]# mkdir -p /data/elasticsearch/{data,logs}

[root@elk-1 ~]# chown -R elasticsearch. /data/elasticsearch/

[root@elk-1 ~]# chown -R elasticsearch. /home/elk/elasticsearch/elasticsearch-7.2.1
修改elasticsearch.yml配置文件
- master节点配置文件
[root@elk-1 config]# grep -Ev "^$|^[#;]" elasticsearch.yml

cluster.name: master-node

node.name: master

node.master: true

node.data: true

http.cors.enabled: true

http.cors.allow-origin: /.*/

path.data: /home/elk/data

network.host: 0.0.0.0

http.port: 9200

discovery.seed_hosts: ["192.168.108.151", "192.168.108.152", "192.168.108.153"]

cluster.initial_master_nodes: ["master", "data-node1","data-node2"]
- node1节点配置文件
[root@elk-2 config]# grep -Ev "^$|^[#;]" elasticsearch.yml

cluster.name: master-node

node.name: data-node1

node.master: true

node.data: true

path.data: /home/elk/data

network.host: 0.0.0.0

http.port: 9200

discovery.seed_hosts: ["192.168.108.151", "192.168.108.152", "192.168.108.153"]

cluster.initial_master_nodes: ["master-node", "data-node1","data-node2"]
- node2节点配置文件
[root@elk-3 config]# grep -Ev "^$|^[#;]" elasticsearch.yml

cluster.name: master-node

node.name: data-node2

node.master: true

node.data: true

path.data: /home/elk/data

network.host: 0.0.0.0

http.port: 9200

discovery.seed_hosts: ["192.168.108.151", "192.168.108.152", "192.168.108.153"]

cluster.initial_master_nodes: ["master", "data-node1","data-node2"]
- 修改elasticsearch的JVM内存
[root@elk-1 config]# grep -Ev "^$|^[#;]" jvm.options -Xms1g -Xmx1g
- 启动elasticsearch
[root@ELK1 elk]# su - elasticsearch

Last login: Mon Aug 12 09:58:23 CST 2019 on pts/1


[elasticsearch@ELK1 ~]$ cd /home/elk/elasticsearch-7.2.1/bin/

[elasticsearch@ELK1 bin]$ ./elasticsearch -d
- 查看端口号,分别为9200和9300
[root@elk-1 config]# ss -tlunp|grep java

tcp LISTEN 0 128 :::9200 :::* users:(("java",pid=50257,fd=263))

tcp LISTEN 0 128 :::9300 :::* users:(("java",pid=50257,fd=212))
- es集群基本操作
#查看集群的健康信息

curl 'localhost:9200/_cluster/health?pretty'


#查看集群的详细信息

curl ' localhost:9200/_cluster/state?pretty'


#查询索引列表

curl -XGET http:// localhost:9200/_cat/indices?v


#创建索引

curl -XPUT http:// localhost:9200/customer?pretty


#查询索引

curl -XGET http:// localhost:9200/customer/external/1?pretty


#删除索引

curl -XDELETE http:// localhost:9200/customer?pretty


#删除指定索引

curl -XDELETE localhost:9200/nginx-log-2019.08


#删除多个索引

curl -XDELETE localhost:9200/system-log-2019.0606,system-log-2019.0607


#删除所有索引

curl -XDELETE localhost:9200/_all


#在删除数据时,通常不建议使用通配符,误删后果会很严重,所有的index都可能被删除,为了安全起见需要禁止通配符,可以在elasticsearch.yml配置文件中设置禁用_all和*通配符

action.destructive_requires_name: true
Elasticsearch Head插件
参考
https://blog.csdn.net/ljx1528/article/details/100031330
https://blog.csdn.net/zhengdesheng19930211/article/details/80249919
https://blog.csdn.net/callmepls1/article/details/79441505
http://www.mamicode.com/info-detail-2344537.html
https://blog.csdn.net/Ahri_J/article/details/79609444