1、实现源码
<%@ page language="java" import="java.util.*" pageEncoding="UTF-8"%>
<%
String path = request.getContextPath();
String basePath = request.getScheme()+"://"+request.getServerName()+":"+request.getServerPort()+path+"/";
%>
<!DOCTYPE HTML PUBLIC "-//W3C//DTD HTML 4.01 Transitional//EN">
<html>
<head>
<base href="<%=basePath%>">
<title>最新版FusionCharts2D面积图</title>
<meta http-equiv="pragma" content="no-cache">
<meta http-equiv="cache-control" content="no-cache">
<meta http-equiv="expires" content="0">
<meta http-equiv="keywords" content="keyword1,keyword2,keyword3">
<meta http-equiv="description" content="This is my page">
<script type="text/javascript" src="<%=basePath%>/js/jquery-2.2.3.js"></script>
<script type="text/javascript" src="<%=basePath%>/js/fusioncharts/js/fusioncharts.js"></script>
<script type="text/javascript" src="<%=basePath%>/js/fusioncharts/js/fusioncharts.charts.js"></script>
<script type="text/javascript">
FusionCharts.ready(function () {
var salesChart = new FusionCharts({
type: 'area2d',
renderAt: 'area2D',
'1290',
height: '600',
dataFormat: 'json',
dataSource: {
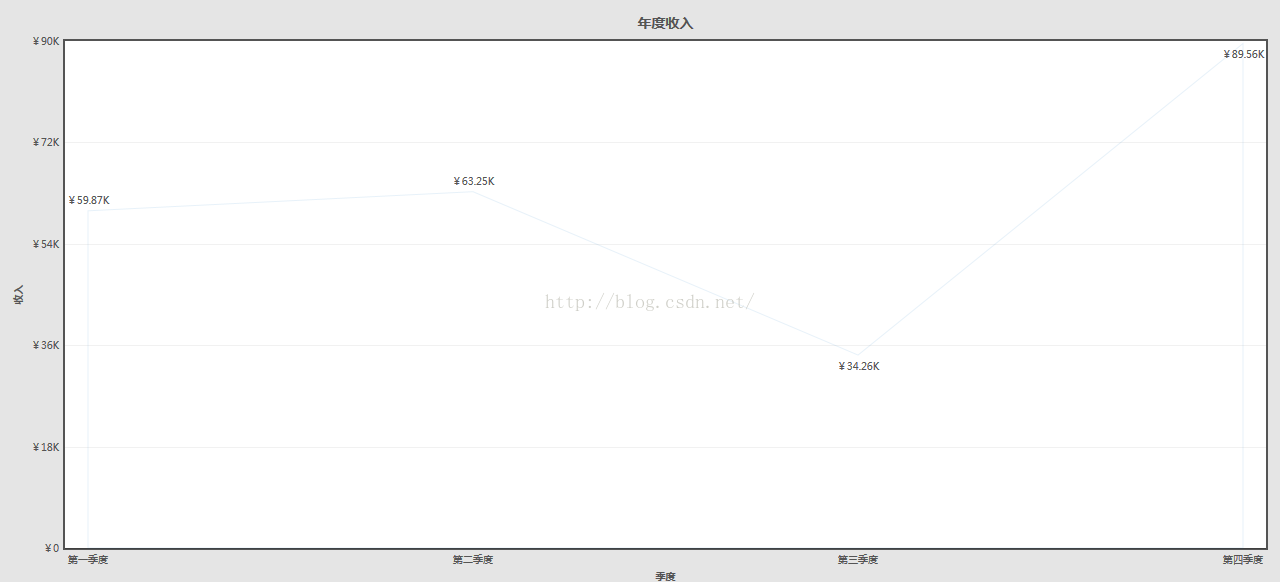
"chart": {
"caption": "年度收入",
"subCaption": "",
"xAxisName": "季度",
"yAxisName": "收入",
"numberPrefix": "¥",
"paletteColors": "#1275c2",
"bgColor": "#CCCCCC",
"showBorder": "1",
"showCanvasBorder": "1",
"plotBorderAlpha": "10",
"usePlotGradientColor": "10",
"plotFillAlpha": "50",
"showXAxisLine": "1",
"axisLineAlpha": "25",
"divLineAlpha": "10",
"showValues": "1",
"showAlternateHGridColor": "0",
"captionFontSize": "14",
"subcaptionFontSize": "14",
"subcaptionFontBold": "0",
"toolTipColor": "#ffffff",
"toolTipBorderThickness": "1",
"toolTipBgColor": "#FF0000",
"toolTipBgAlpha": "60",
"toolTipBorderRadius": "5",
"toolTipPadding": "10",
"baseFont":"20"
},
"data": [
{
"label": "第一季度",
"value": "59865"
},
{
"label": "第二季度",
"value": "63254"
},
{
"label": "第三季度",
"value": "34256"
},
{
"label": "第四季度",
"value": "89562"
}
]
}
}).render();
});
</script>
</head>
<body>
<div id="area2D"></div>
</body>
</html>
2、实现结果