• echarts柱状图上下颠倒


    放上options配置

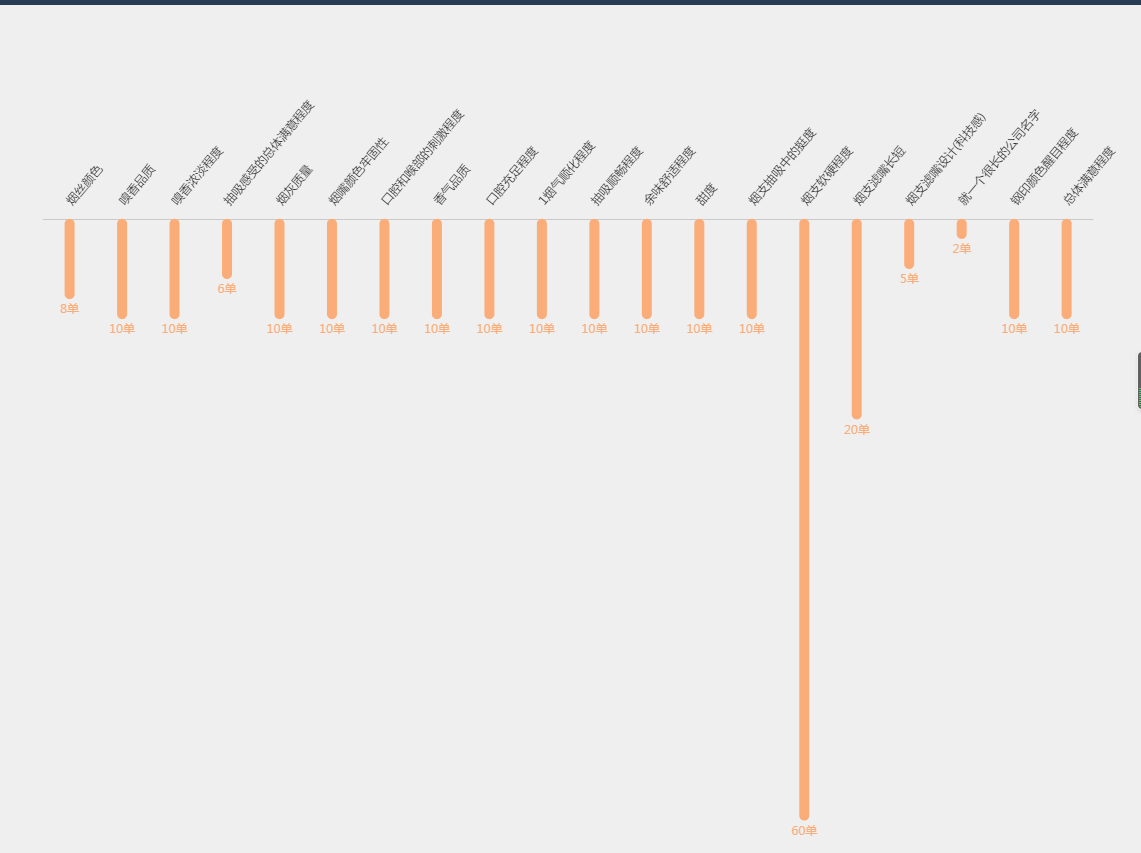
    //财务格式
    function formatNum(strNum) {
        if (strNum.length <= 3) {
            return strNum;
        }
        if (!/^(+|-)?(d+)(.d+)?$/.test(strNum)) {
            return strNum;
        }
        var a = RegExp.$1,
            b = RegExp.$2,
            c = RegExp.$3;
        var re = new RegExp();
        re.compile("(\d)(\d{3})(,|$)");
        while (re.test(b)) {
            b = b.replace(re, "$1,$2$3");
        }
        return a + "" + b + "" + c;
    }
    //数据
    var legendData = [];
    var xAxisData = ["烟丝颜色", "嗅香品质", "嗅香浓淡程度", "抽吸感受的总体满意程度", 
    "烟灰质量", "烟嘴颜色牢固性", "口腔和喉部的刺激程度", "香气品质", "口腔充足程度",
    "1烟气顺化程度", "抽吸顺畅程度", "余味舒适程度","甜度","烟支抽吸中的挺度",
    "烟支软硬程度","烟支滤嘴长短","烟支滤嘴设计(科技感)","就一个很长的公司名字",
    "钢印颜色醒目程度","总体满意程度"];
    var yAxisData = xAxisData;
    var seriesName1 = "特征消费者的敏感指标分布";
    var seriesData1 = ["8","10","10","6","10","10","10","10","10","10",
    "10","10","10","10","60","20","5","2","10","10","1"];
    
    var option = {
        tooltip: { //提示框组件
            trigger: 'axis',
            formatter:function(params){  
              var relVal = params[0].name;  
              for (var i = 0, l = params.length; i < l; i++) { 
                      relVal +=  ' : ' + formatNum(params[i].value)+""; 
              }  
              return relVal;
            },
            axisPointer: {
                type: 'shadow',
                label: {
                    backgroundColor: '#6a7985'
                }
            },
            textStyle: {
                color: '#fff',
                fontStyle: 'normal',
                fontFamily: '微软雅黑',
                fontSize: 12,
            }
        },
        grid: {
            left: '1%',
            right: '4%',
            bottom: '6%',
            top:80,
            padding:'0 0 10 0',
            containLabel: true,
        },
        xAxis: [
            {   
                type: 'category',
                boundaryGap: true,//坐标轴两边留白
                data: xAxisData,
                position:'top',
                axisLabel: { //坐标轴刻度标签的相关设置。
                    interval: 0,//设置为 1,表示『隔一个标签显示一个标签』
                    margin:15,
                    textStyle: {
                    //     color: '#4c647c',
                        fontStyle: 'normal',
                        fontFamily: '微软雅黑',
                        fontSize: 12,
                    },
                    rotate:50,
                },
                axisTick:{//坐标轴刻度相关设置。
                    show: false,
                },
                axisLine:{//坐标轴轴线相关设置
                    lineStyle:{
                    //     color:'#4c647c',
                        opacity:0.2
                    }
                },
                splitLine: { //坐标轴在 grid 区域中的分隔线。
                    show: false,
                }
            }
        ],
        yAxis: [
            {   
                show:false,
                inverse: true,
                type: 'value',
                splitNumber: 5,
                axisLabel: {
                    textStyle: {
                        color: '#4c647c',
                        fontStyle: 'normal',
                        fontFamily: '微软雅黑',
                        fontSize: 12,
                    }
                },
                axisLine:{
                    show: false
                },
                axisTick:{
                    show: false
                },
                splitLine: {
                    show: true,
                    lineStyle: {
                        color: ['#000'],
                        opacity:0.06
                    }
                }
            }
        ],
        series : [
            {
                name:seriesName1,
                type:'bar',
                data:seriesData1,
                barWidth: 10,
                barGap:0,//柱间距离
                label: {//图形上的文本标签
                    normal: {
                      show: true,
                      position: 'bottom',
                      formatter: function(p) {
                            return formatNum(p.value) + "";
                        },
                      textStyle: {
                          color: '#FBAD79',
                          fontStyle: 'normal',
                          fontFamily: '微软雅黑',
                          fontSize: 12,   
                      },
                    },
                },
                itemStyle: {//图形样式
                    normal: {
                        barBorderRadius: 20,
                        color:'#FBAD79'
                    }
    
                },
            }
           
            
        ]
    };
    View Code
  • 相关阅读:
    Flash与JS之间相互调用以及参数传递
    在Javascript中监听flash事件(转)
    DataTables.js插入数据的两种方式
    DataTable在内存中的使用
    oracle分页存储过程
    清空highcharts数据
    JDBC源码分析(加载过程)
    MAVEN实现多环境搭建
    Maven基础
    Ajax如何提交数据到springMVC后台
  • 原文地址:https://www.cnblogs.com/huchong-bk/p/13139081.html
Copyright © 2020-2023  润新知