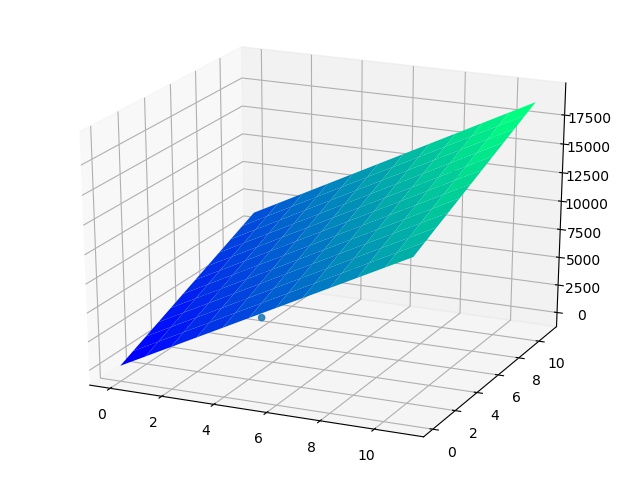
功能:通过样本进行训练,让线性单元自己找到(这就是所谓机器学习)工资计算的规律,然后用两组数据进行测试机器是否真的get到了其中的规律。
原文链接在文尾,文章中的代码为了演示起见,仅根据工作年限来预测工资,参数是一维的,最后绘制的图也是平面图。本着学习的态度,我将代码改为能根据两个参数来预测工资,两个参数分别是工作年限和级别,并且用3D图绘制出拟合的效果。原作者的代码是适用于Python2.7的,我的代码适用于Python3,谨供参考。
注意:绘图代码需要安装matplotlib。
代码:
 1 #!/usr/bin/env python
 2 # -*- coding: UTF-8 -*-
 3
 4 from Perceptron import Perceptron
 5
 6
 7 #定义激活函数f
 8 f = lambda x: x
 9
10 class LinearUnit(Perceptron):
11     def __init__(self, input_num):
12         '''初始化线性单元,设置输入参数的个数'''
13         Perceptron.__init__(self, input_num, f)
14
15
16 def get_training_dataset():
17     '''
18     捏造5个人的收入数据
19     '''
20     # 构建训练数据
21     # 输入向量列表,每一项的第一个是工作年限,第二个是级别
22     # 构造这些数据所用的公式是:工资=1000*年限 + 500*级别,看机器是否能猜出来
23     input_vecs = [[5,1], [3, 7], [8,2], [1.5,5], [10,6]]
24     # 期望的输出列表,月薪,注意要与输入一一对应。【注意! 我故意让结果不太准确,这也会导致预测的结果有偏差】
25     labels = [5200, 6700, 9300, 3500, 15500]
26     return input_vecs, labels
27
28
29 def train_linear_unit():
30     '''
31     使用数据训练线性单元
32     '''
33     # 创建感知器,输入参数的特征数为2(工作年限,级别)
34     lu = LinearUnit(2)
35     # 训练,迭代10轮, 学习速率为0.005
36     input_vecs, labels = get_training_dataset()
37     lu.train(input_vecs, labels, 10, 0.005)
38     #返回训练好的线性单元
39     return lu
40
41
42 def plot(linear_unit):
43     import numpy as np
44     from mpl_toolkits.mplot3d import Axes3D
45     import matplotlib.pyplot as plt
46     input_vecs, labels = get_training_dataset()
47     fig = plt.figure()
48     ax = Axes3D(fig)
49     ax.scatter(list(map(lambda x: x[0], input_vecs)),
50                list(map(lambda x: x[1], input_vecs)),
51                labels)
52
53     weights = linear_unit.weights
54     bias = linear_unit.bias
55     x = range(0,12,1) # work age
56     y = range(0,12,1) # level
57     x, y = np.meshgrid(x, y)
58     z = weights[0] * x + weights[1] * y + bias
59     ax.plot_surface(x, y, z, cmap=plt.cm.winter)
60
61     plt.show()
62
63
64 if __name__ == '__main__':
65     '''训练线性单元'''
66     linear_unit = train_linear_unit()
67     # 打印训练获得的权重
68     #print (linear_unit)
69     # 测试
70     print ('预测:')
71     print ('Work 3.4 years, level 2, monthly salary = %.2f' % linear_unit.predict([3.4,2]))
72     print ('Work 15 years, level 6, monthly salary = %.2f' % linear_unit.predict([15,6]))
73     plot(linear_unit)
为了代码的正常运行,你可能还需要下面这个感知机的类文件,另存为Perceptron.py(注意大小写),和上面的代码放在同一个目录下即可。
  1 #coding=utf-8
  2
  3 from functools import reduce  # for py3
  4
  5 class Perceptron(object):
  6     def __init__(self, input_num, activator):
  7         '''
  8         初始化感知器,设置输入参数的个数,以及激活函数。
  9         激活函数的类型为double -> double
 10         '''
 11         self.activator = activator
 12         # 权重向量初始化为0
 13         self.weights = [0.0 for _ in range(input_num)]
 14         # 偏置项初始化为0
 15         self.bias = 0.0
 16     def __str__(self):
 17         '''
 18         打印学习到的权重、偏置项
 19         '''
 20         return 'weights	:%s
bias	:%f
' % (self.weights, self.bias)
 21
 22
 23     def predict(self, input_vec):
 24         '''
 25         输入向量,输出感知器的计算结果
 26         '''
 27         # 把input_vec[x1,x2,x3...]和weights[w1,w2,w3,...]打包在一起
 28         # 变成[(x1,w1),(x2,w2),(x3,w3),...]
 29         # 然后利用map函数计算[x1*w1, x2*w2, x3*w3]
 30         # 最后利用reduce求和
 31
 32         #list1 = list(self.weights)
 33         #print ("predict self.weights:", list1)
 34
 35
 36         return self.activator(
 37             reduce(lambda a, b: a + b,
 38                    list(map(lambda tp: tp[0] * tp[1],
 39                        zip(input_vec, self.weights)))
 40                 , 0.0) + self.bias)
 41     def train(self, input_vecs, labels, iteration, rate):
 42         '''
 43         输入训练数据:一组向量、与每个向量对应的label;以及训练轮数、学习率
 44         '''
 45         for i in range(iteration):
 46             self._one_iteration(input_vecs, labels, rate)
 47
 48     def _one_iteration(self, input_vecs, labels, rate):
 49         '''
 50         一次迭代,把所有的训练数据过一遍
 51         '''
 52         # 把输入和输出打包在一起,成为样本的列表[(input_vec, label), ...]
 53         # 而每个训练样本是(input_vec, label)
 54         samples = zip(input_vecs, labels)
 55         # 对每个样本,按照感知器规则更新权重
 56         for (input_vec, label) in samples:
 57             # 计算感知器在当前权重下的输出
 58             output = self.predict(input_vec)
 59             # 更新权重
 60             self._update_weights(input_vec, output, label, rate)
 61
 62     def _update_weights(self, input_vec, output, label, rate):
 63         '''
 64         按照感知器规则更新权重
 65         '''
 66         # 把input_vec[x1,x2,x3,...]和weights[w1,w2,w3,...]打包在一起
 67         # 变成[(x1,w1),(x2,w2),(x3,w3),...]
 68         # 然后利用感知器规则更新权重
 69         delta = label - output
 70         self.weights = list(map( lambda tp: tp[1] + rate * delta * tp[0], zip(input_vec, self.weights)) )
 71
 72         # 更新bias
 73         self.bias += rate * delta
 74
 75         print("_update_weights() -------------")
 76         print("label - output = delta:" ,label, output, delta)
 77         print("weights ", self.weights)
 78         print("bias", self.bias)
 79
 80
 81
 82
 83
 84 def f(x):
 85     '''
 86     定义激活函数f
 87     '''
 88     return 1 if x > 0 else 0
 89
 90 def get_training_dataset():
 91     '''
 92     基于and真值表构建训练数据
 93     '''
 94     # 构建训练数据
 95     # 输入向量列表
 96     input_vecs = [[1,1], [0,0], [1,0], [0,1]]
 97     # 期望的输出列表,注意要与输入一一对应
 98     # [1,1] -> 1, [0,0] -> 0, [1,0] -> 0, [0,1] -> 0
 99     labels = [1, 0, 0, 0]
100     return input_vecs, labels
101
102 def train_and_perceptron():
103     '''
104     使用and真值表训练感知器
105     '''
106     # 创建感知器,输入参数个数为2(因为and是二元函数),激活函数为f
107     p = Perceptron(2, f)
108     # 训练,迭代10轮, 学习速率为0.1
109     input_vecs, labels = get_training_dataset()
110     p.train(input_vecs, labels, 10, 0.1)
111     #返回训练好的感知器
112     return p
113
114 if __name__ == '__main__':
115     # 训练and感知器
116     and_perception = train_and_perceptron()
117     # 打印训练获得的权重
118
119     # 测试
120     print (and_perception)
121     print ('1 and 1 = %d' % and_perception.predict([1, 1]))
122     print ('0 and 0 = %d' % and_perception.predict([0, 0]))
123     print ('1 and 0 = %d' % and_perception.predict([1, 0]))
124     print ('0 and 1 = %d' % and_perception.predict([0, 1]))
正常运行的话,输出的预测结果是这样的:
预测:
Work 3.4 years, level 2, monthly salary = 5125.02
Work 15 years, level 6, monthly salary = 20815.01

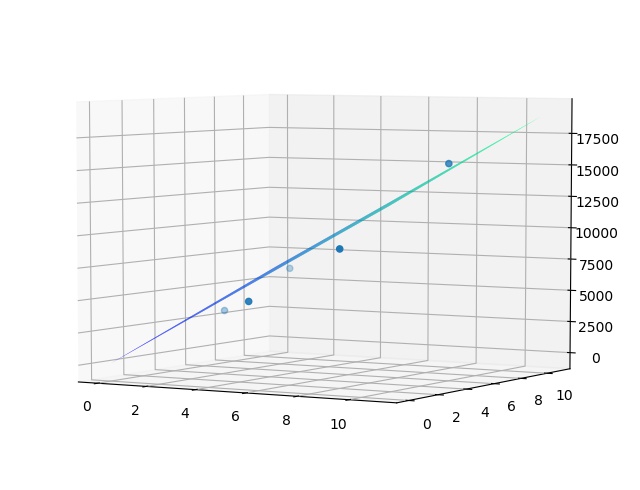
由上可见,本例中两个输入一个输出的线性单元拟合出来的是一个平面(因为预设的工资公式是线性的)。在旋转一个角度后看的更清楚:

原文链接:
https://www.zybuluo.com/hanbingtao/note/448086
文章写的很好,代码也漂亮,墙裂推荐大家看看原文。