灰度化处理就是将一幅色彩图像转化为灰度图像的过程。彩色图像分为R,G,B三个分量,
分别显示出红绿蓝等各种颜色,灰度化就是使彩色的R,G,B分量相等的过程。
灰度值大的像素点比较亮(像素值最大为255,为白色),反之比较暗(像素最下为0,为黑色)。
    图像灰度化的算法主要有以下3种:

data2 = data.mean(axis = 2)


data3 = np.dot(data,[0.299,0.587,0.114])
Matplotlib中的基本图表包括的元素


x轴和y轴
水平和垂直的轴线

x轴和y轴刻度
刻度标示坐标轴的分隔,包括最小刻度和最大刻度

x轴和y轴刻度标签
表示特定坐标轴的值

绘图区域
实际绘图的区域
绘制一条曲线

x = np.arange(0.0,6.0,0.01)
plt.plot(x, x**2)
plt.show()
绘制多条曲线

x = np.arange(1, 5,0.01)
plt.plot(x, x**2)
plt.plot(x, x**3.0)
plt.plot(x, x*3.0)
plt.show()


x = np.arange(1, 5)
plt.plot(x, x*1.5, x, x*3.0, x, x/3.0)
plt.show()
绘制网格线

设置grid参数(参数与plot函数相同)
lw代表linewidth,线的粗细
alpha表示线的明暗程度

# 使用子图显示不同网格线对比
fig  = plt.figure(figsize=(20,3))

x = np.linspace(0, 5, 100)

# 使用默认网格设置
ax1 = fig.add_subplot(131)
ax1.plot(x, x**2, x, x**3,lw=2)
ax1.grid(True) # 显式网格线

# 对网格线进行设置
ax2 = fig.add_subplot(132)
ax2.plot(x, x**2, x, x**4, lw=2)
ax2.grid(color='r', alpha=0.5, linestyle='dashed', linewidth=0.5) # grid函数中用与plot函数同样的参数设置网格线
# 对网格线进行设置
ax3 = fig.add_subplot(133)
ax3.plot(x, x**2, x, x**4, lw=2)
ax3.grid(color='r', alpha=0.5, linestyle='-.', linewidth=0.5) # grid函数中用与plot函数同样的参数设置网格线
坐标轴界限 axis 方法

x = np.arange(1, 5)
plt.plot(x, x*1.5, x, x*3.0, x, x/3.0)
# plt.axis() # shows the current axis limits values;如果axis方法没有任何参数,则返回当前坐标轴的上下限
# (1.0, 4.0, 0.0, 12.0)
# plt.axis([0, 15, -5, 13]) # set new axes limits;axis方法中有参数,设置坐标轴的上下限;参数顺序为[xmin, xmax, ymin, ymax]
plt.axis(xmax=5,ymax=23) # 可使用xmax,ymax参数
plt.show()


设置紧凑型坐标轴
x = np.arange(1, 5)
plt.plot(x, x*1.5, x, x*3.0, x, x/3.0)
plt.axis('tight') # 紧凑型坐标轴
plt.show()


plt除了axis方法设置坐标轴范围,还可以通过xlim,ylim设置坐标轴范围
x = np.arange(1, 5)
plt.plot(x, x*1.5, x, x*3.0, x, x/3.0)
plt.xlim([0, 5]) # ylim([ymin, ymax])
plt.ylim([-1, 13]) # xlim([xmin, xmax])
plt.show()
坐标轴标签

plt.plot([1, 3, 2, 4])
plt.xlabel('This is the X axis')
plt.ylabel('This is the Y axis')
plt.show()
坐标轴标题

plt.plot([1, 3, 2, 4])
plt.title('Simple plot')
plt.show()
label参数为'_nolegend_',则图例中不显示


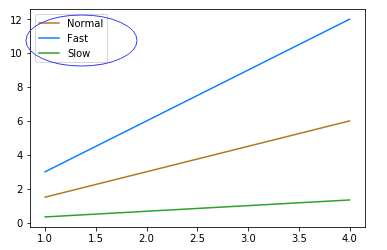
x = np.arange(1, 5)
plt.plot(x, x*1.5, label = '_nolegend_') # label参数为'_nolegend_',则图例中不显示
plt.plot(x, x*3.0, label='Fast')
plt.plot(x, x/3.0, label='Slow')
plt.legend()
plt.show()
图例 legend

legend方法
两种传参方法:


【推荐使用】在plot函数中增加label参数
在legend方法中传入字符串列表

方法一:
x = np.arange(1, 5)
plt.plot(x, x*1.5, label='Normal') # 在plot函数中增加label参数
plt.plot(x, x*3.0, label='Fast')
plt.plot(x, x/3.0, label='Slow')
plt.legend()
plt.show()

方法二:
x = np.arange(1, 5)
plt.plot(x, x*1.5)
plt.plot(x, x*3.0)
plt.plot(x, x/3.0)
plt.legend(['Normal', 'Fast', 'Slow']) # 在legend方法中传入字符串列表
plt.show()
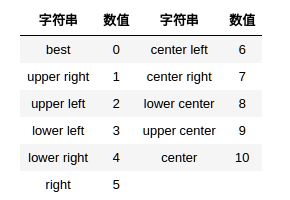
loc 参数

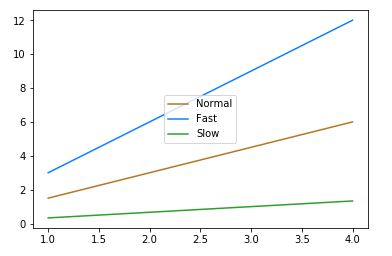
x = np.arange(1, 5)
plt.plot(x, x*1.5, label='Normal')
plt.plot(x, x*3.0, label='Fast')
plt.plot(x, x/3.0, label='Slow')
plt.legend(loc=10)
plt.show()

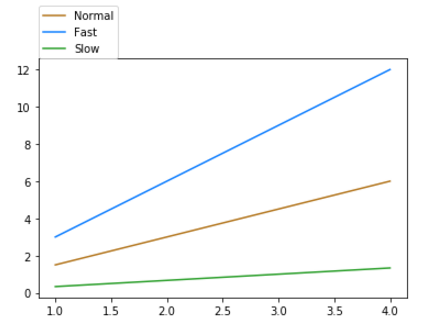
loc参数可以是2元素的元组,表示图例左下角的坐标

x = np.arange(1, 5)
plt.plot(x, x*1.5, label='Normal')
plt.plot(x, x*3.0, label='Fast')
plt.plot(x, x/3.0, label='Slow')
plt.legend(loc=(0,1)) # loc参数可以是2元素的元组,表示图例左下角的坐标
plt.show()
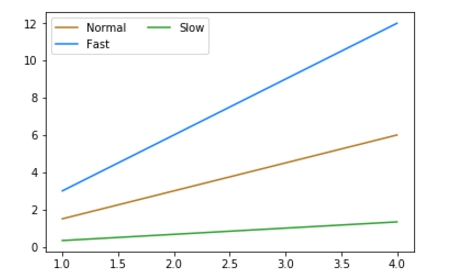
ncol参数控制图例中有几列

x = np.arange(1, 5)
plt.plot(x, x*1.5, label='Normal')
plt.plot(x, x*3.0, label='Fast')
plt.plot(x, x/3.0, label='Slow')
plt.legend(loc=0, ncol=2) # ncol控制图例中有几列
plt.show()
linestyle 属性

plt.plot(np.random.randn(1000).cumsum(), linestyle = ':',marker = '.', label='one')
plt.plot(np.random.randn(1000).cumsum(), 'r--', label='two')
plt.plot(np.random.randn(1000).cumsum(), 'b.', label='three')
plt.legend(loc='best') # loc='best'
plt.show()

保存图片

filename
含有文件路径的字符串或Python的文件型对象。图像格式由文件扩展名推断得出,例如,.pdf推断出PDF,.png推断出PNG (“png”、“pdf”、“svg”、“ps”、“eps”……)
dpi
图像分辨率(每英寸点数),默认为100
facecolor
图像的背景色,默认为“w”(白色)


x = np.random.randn(1000).cumsum()
fig = plt.figure(figsize = (10,3))

splt = fig.add_subplot(111)
splt.plot(x)

fig.savefig(filename = "filena.eps",dpi = 100,facecolor = 'g')
2020-05-24