表单在现代Web应用中占据着重要地位。
表单可以很简单,也可以非常复杂,要横跨几个页面。
除了从用户哪里获得数据,Web应用还需要以容易看懂的方式展示数据。表格是展示复杂数据的最佳方式。
1.设计数据表
1.1 表格专有元素
HTML中的表格是通过table元素来创建的,表格由tr(table row,行)和td(table data cell,数据单元)组成。
表题是表格的标题,用caption表示。
<table class="cal">
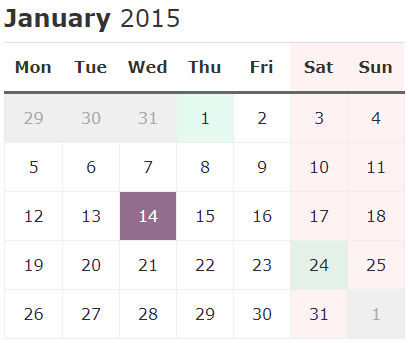
	<caption><strong>January</strong> 2015</caption>
</table>
表头、表体和表脚分别用thead、tbody和tfoot来表示。
如果使用thea或tfoot,那至少也要使用一个tbody。
一个表中只能有一个thead或tfoot,但可以有多个tbody,以便把复杂的表切分成更小也更容易维护的数据块。
列标题和行标题应该使用th来表示,然后通过scope属性的值说明它们是行标题(row)还是列标题(col)。scope属性的值还可以是rowgroup或colgroup,表示这个行标题或列标题的范围涵盖多行或多列。
可以列标题放在thead中,单独给它们定义一种样式。
<thead>
    <tr>
        <th scope="col">Mon</th>
        <!-- 省略 -->
        <th scope="col">Sun</th>
    </tr>
</thead>
通过col和colgroup给某一列添加样式。
colgroup用于定义列组,每一列由一个col定义。
colgroup要放在table里,位于caption的后面,thead、tfoot或tbody的前面。
<table class="cal">
	<caption><strong>January</strong> 2015</caption>
	<colgroup>
		<col class="cal-mon">
		<!-- 省略 -->
	</colgroup>
	<thead>
		<tr>
		  <th abbr="Monday" scope="col">Mon</th>
		  <!-- 省略 -->
		</tr>
	</thead>
	<tbody>
		<tr>
		  <td><a href="#">1</a></td>
		  <!-- 省略 -->
		</tr>
	</tbody>
</table>
可以应用给列的样式非常有限,只有background、border、width和visibility。
1.2 为表格应用样式
CSS标准规定了两种表格边框类型:分离型和折叠型(border-collapse: collapse)。
表格单元的大小可以通过table-layout属性来控制,默认情况下,这个属性的值是auto,基本上是由浏览器按照单元格的内容来确定单元格的宽度。
.cal {
    border-collapse: collapse;
    table-layout: fixed;
     100%;
    max- 25em;
    text-align: center;
    /* 省略 */
}
如果把table-layout属性的值改为fixed,那么单元格的宽度就会基于表格第一行中每个单元格的宽度来确定,或者基于col或colgroup元素的宽度来确定。
去掉链接的下划线,并让它们显示为块级元素,这样每个链接都会填满自己所在的单元格,让可点击区域变大。
.cal a {
    display: block;
    text-decoration: none;
}
给链接的悬停和聚焦状态应用样式。
.cal a:hover,
.cal a:focus {
    background-color: #cde7ca;
    background-color: rgba(167, 240, 210, 0.3);
}
/* 设置不在当月的日期 */
.cal-inactive {
  background-color: #efefef;
  color: #aaa;
  cursor: not-allowed; /* 表示不能选中的悬停光标样式 */
}
/* 设置当前日期 */
.cal-current {
    background-color: #7d5977;
    background-color: rgba(71, 14, 62, 0.6);
}
.cal-current a {
    color: #fff;
}

1.3 响应式表格
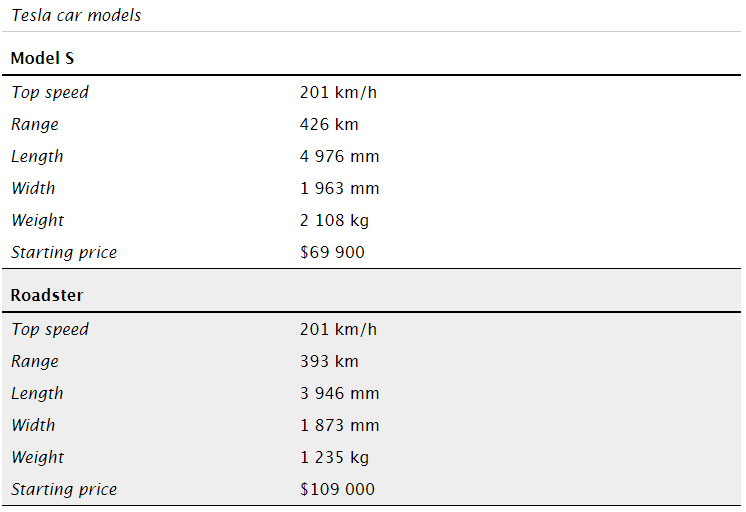
我们可以让不是表格的元素具有“网格性质”,从而实现我们想要的布局。反过来,我们也可以让表格不显示为表格。
<table class="cars">
    <caption>Tesla car models</caption>
    <thead>
        <tr>
            <th scope="col">Model</th>
            <th scope="col">Top speed</th>
            <!-- 省略 -->
        </tr>
    </thead>
    <tbody>
        <tr>
            <th scope="row">Model S</th>
            <td data-label="Top speed">201 km/h</td>
            <!-- 省略 -->
        </tr>
        <!-- 省略 -->
	</tbody>
</table>
.cars {
     100%;
    border-collapse: collapse;
}
/* 斑马条纹 */
.cars tr:nth-child(even) {
    background-color: #eee; /* 设置偶数行的背景色 */
}
/* 设置行高和内边距 */
.cars caption,
.cars th,
.cars td {
    text-align: left;
    padding: 0 .5em;
    line-height: 2;
}

表格有很多默认样式和显示模式。我们使用max-width条件,这样就把小屏幕作为一种特殊情况来处理。
@media only screen and (max- 760px) {
    .cars {
        display: block;
    }
    .cars thead {
        display: none;
    }
    .cars tr {
        border-bottom: 1px solid;
    }
    .cars td, .cars th {
        display: block;
        float: left;
         100%;
        box-sizing: border-box;
    }
    .cars th {
        font-weight: 600;
        border-bottom: 2px solid;
        padding-top: 10px;
    }
    .cars td:before {
        content: attr(data-label);
         40%;
        display: inline-block;
        font-style: italic;
    }
}
此时,单元格都成了块级元素,并占据100%宽度,结果就是在一行中上下堆叠起来。表格的标题完全隐蔽。
我们把每个列名添加为每个单元格的data-label属性,然后再利用:before伪元素插入这些属性的值。
<!-- 省略 -->
`<td data-label="Top speed">201 km/h</td>`
<!-- 省略 -->
/* 省略 */
.cars td:before {
    /* 使用attr()函数获取属性值 */
    content: attr(data-label);
}
/* 省略 */

参考资料: