一、Numpy
numpy支持大量的维度数组和矩阵运算,对数组运算提供了大量的数学函数库!
numpy比Python列表更具优势,其中一个优势便是速度。在对大型数组执行操作时,numpy的速度比Python列表的速度快了好几百。因为numpy数组本身能节省内存,并且numpy在执行算术、统计和线性代数运算时采用了优化算法。
numpy的另一个强大功能是具有可以表示向量和矩阵的多维数组数据结构。numpy对矩阵运算进行了优化,使我们能够高效地执行线性代数运算,使其非常适合解决机器学习问题。
与Python列表相比,numpy具有的另一个强大优势是具有大量优化的内置数学函数。这些函数使你能够非常快速地进行各种复杂的数学计算,并且用到很少代码(无需使用复杂的循环),使程序更容易读懂和理解。
1、简单创建数组
a = [1, 2, 3]
b = np.array(a)
c = np.array([[0, 1, 2, 10],
              [12, 13, 100, 101],
              [102, 110, 112, 113]], int)
print(c)
print(b)
2、创建随机数组
array_rand = np.random.rand(10, 10, 4)
print(array_rand)
print(array_rand.ndim)
3、数组的复制
after_array = array_normal[:3, 2:4].copy()
copy_array = np.copy(array_normal[:, 2:4])
4、数组运算
# 循环数组行和列,每一个数值都加5
score[:, :] = score[:, :]+5
print(score)
# 循环数组行和列,每一个数值都减5
score[:, :] = score[:, :]-5
print(score)
# 循环数组行和列,每一个数值都乘以5
score[:, :] = score[:, :]*5
print(score)
# 循环数组行和列,每一个数值都除以5
score[:, :] = score[:, :]/5
print(score)
# 循环数组行和列,每一个数值除以5取整
score[:, :] = score[:, :] // 5
print(score)
# 循环数组行和列,每一个数值除以5取模
score[:, :] = score[:, :] % 5
print(score)
二、Matplotlib
Matplotlib 是Python中类似 MATLAB 的绘图工具,熟悉 MATLAB 也可以很快的上手Matplotlib。
Matplotlib 是一个 Python 的 2D绘图库,它以各种硬拷贝格式和跨平台的交互式环境生成出版质量级别的图形 。
通过 Matplotlib,开发者可以仅需要几行代码,便可以生成绘图,直方图,功率谱,条形图,错误图,散点图等。
matplotlib图标正常显示中文
为了在图表中能够显示中文和负号等,需要下面一段设置:
import matplotlib.pyplot as plt
plt.rcParams['font.sas-serig']=['SimHei'] #用来正常显示中文标签
plt.rcParams['axes.unicode_minus']=False #用来正常显示负号
pyplot文本显示函数
plt.xlabel():对x轴增加文本标签
plt.ylabel():同理
plt.title(): 对图形整体增加文本标签
plt.text(): 在任意位置增加文本
plt. annotate(s, xy = arrow_crd, xytext = text_crd, arrowprops = dict)
Plot的图表函数
plt.plot(x,y , fmt) :绘制坐标图
plt.boxplot(data, notch, position): 绘制箱形图
plt.bar(left, height, width, bottom) : 绘制条形图
plt.barh(width, bottom, left, height) : 绘制横向条形图
plt.polar(theta, r) : 绘制极坐标图
plt.pie(data, explode) : 绘制饼图
plt.scatter(x, y) :绘制散点图
plt.hist(x, bings, normed) : 绘制直方图
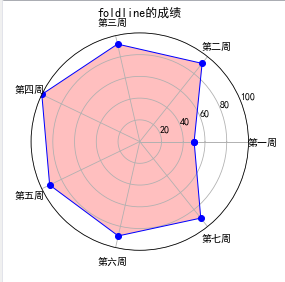
Python成绩雷达图
代码如下
# -*- coding: utf-8 -*-
"""
Spyder Editor

This is a temporary script file.
"""
#e19.DrawDotaRadar.py
import numpy as np
import matplotlib.pyplot as plt
import matplotlib
matplotlib.rcParams['font.family']='SimHei'
matplotlib.rcParams['font.sans-serif']=['SimHei']
labels=np.array(['第一周','第二周','第三周','第四周','第五周','第六周','第七周'])
nAttr=7
data=np.array([50,92,92,100,92,89,90])
angles=np.linspace(0,2*np.pi,nAttr,endpoint=False)
data=np.concatenate((angles,[angles[0]]))
fig=plt.figure(facecolor="white")
plt.subplot(111,polar=True)
plt.plot(angles,data,'bo-',color='g',linewidth=2)
plt.fill(angles,data,facecolor='g',alpha=0.25)
plt.thetagrids(angles*180/np.pi,labels)
plt.figtext(0.25,0.95,'foldline的成绩',ha='center')
plt.grid(True)
plt.show()
效果图如下

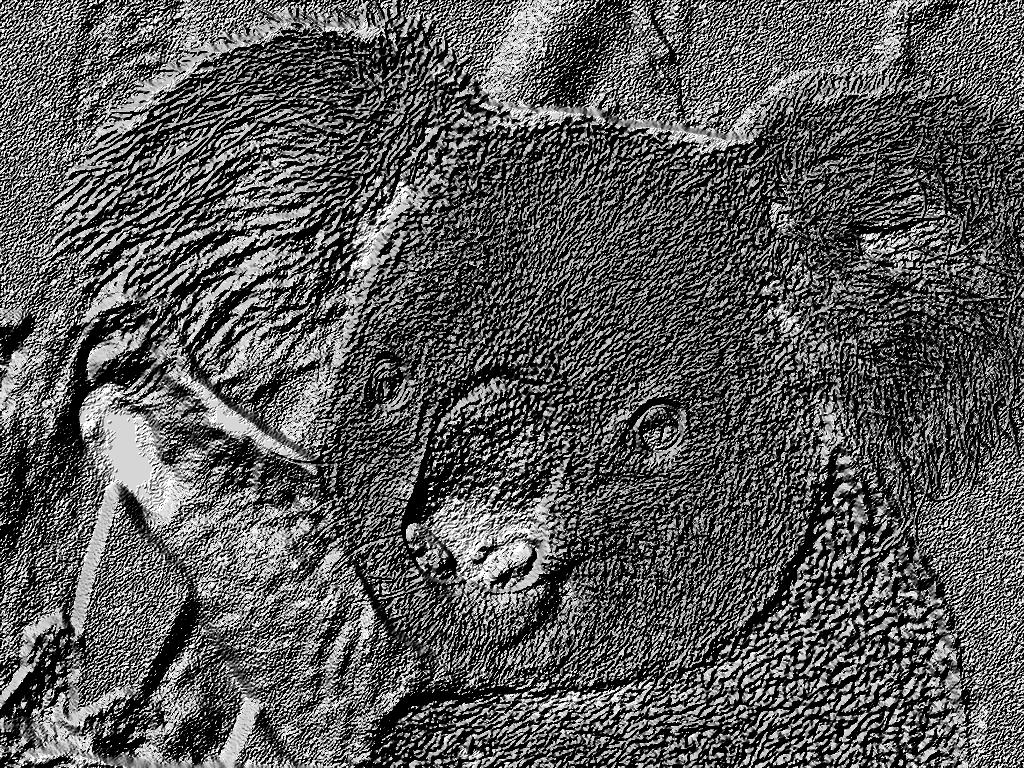
手绘图效果
from PIL import Image
import numpy as np
vec_el = np.pi/3.3# 光源的俯视角度,弧度值
vec_az = np.pi/9#光源的方位角度,弧度值
depth = 5#(0-100)值越大,整体画面灰度值较深,有近似浮雕的效果;值越小,背景区域接近白色
im = Image.open('D:AnacondaKoala.jpg').convert('L')
a = np.asarray(im).astype('float')
grad = np.gradient(a)#取图像灰度的梯度值
grad_x,grad_y = grad#分别取横纵图像梯度值
grad_x = grad_x+depth/100.
gred_y = grad_y+depth/100.
dx = np.cos(vec_el)*np.cos(vec_az)#光源对x轴的影响
dy = np.cos(vec_el)*np.cos(vec_az)#光源对y轴的影响
dz = np.sin(vec_el) #光源对z轴的影响
A = np.sqrt(grad_x**2+grad_y**2+1.)
uni_x = grad_x/A
uni_y = grad_y/A
uni_z = 1./A
a2 = 255*(dx*uni_x+dy*uni_y+dz*uni_z)#光源归一化
a2 = a2.clip(0,255)#预防溢出0~255这个区间
im2 = Image.fromarray(a2.astype('uint8'))#重构图像
im2.save('D:AnacondaKoala.jpg')
效果图如下

