Common Probability Distributions
Probability Distribution
A probability distribution describes the probabilities of all the possible outcomes for a random variable.
A discrete random variable if one for which the number of possible outcomes can be counted, and for each possible outcome, there is a measurable and positive probability.
A continuous random variable is one for which the number of possible outcome is infinite, even if lower and upper bounds exist.
A cumulative distribution function (CDF) defines the probability that a random variable, X, takes on a value equal to or less than a specific value, x.
F(x)=P(X<=x)
A discrete uniform random variable is one for which the probabilities for all possible outcomes for a discrete random variable are equal.
Binomial Distribution(二项分布)
A binomial random variable may be defined as the number of "success" in a given number of trials, whereby the outcome can be either "success" or "failure". The probability of success, p, is constant for each trial, and the trails are independent.
Note: binomial distribution is a discrete distribution.
A binomial random variable for which the number of trials is 1 is called Bernoulli random variable (伯努利随即变量).

Expected value
For a given serial of n trials,, the expected number of success, or E(X), is given by the following formula:
expectedd value of X = E(X) = np
The intuition is straightforward; if we perform n trails and the probability of success on each trail is p, we expect np successes.
Variance
The variance of a binomial random variable is given by:
variance of X = np(1-p)
Tracking Error
Tracking error is the difference between the total return on a portfolio and the total return on the benchmark against which its performance is measured.
Note: The expression "tracking error" is sometimes used interchangeably with "tracking risk", which refer to the standard deviation of the differences between a portfolio's return and its benchmark return.
Continuous Uniform Distribution
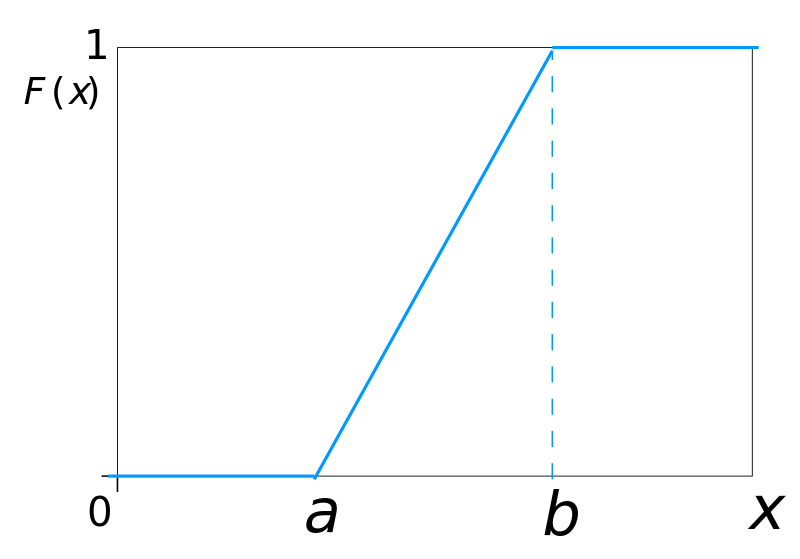
The continuous uniform distribution is defined over a range that spans between some lower limit, a, and some upper limit, b, which serve as the parameters of the distribution. Outcomes can only occur between a and b, and since we are dealing with a continuous distribution, even if a < x < b, P(X=x)=0.
-
PDF (probability density function)

-
CDF (continuous distribution function)

Normal Distribution

Note: some properties of normal distribution:
- Skewness=0
- Kurtosis=3
- A linear combination of normally distributed random variables is also normally distributed.
Standard Normal Distribution (标准正太分布) and Z value
The standard normal distribution is a normal distribution that has been standardized so that is has a mean of zero and a standard deviation of 1.
To standardize an observation from a given normal distribution,, the z-value of the observation must be calculated. The z-value represents the number of standard deviations a given observation is from the population mean. Standardization is the process of converting an observed value for a random variable to its z-value.
z = [observation-population mean]/[standard deviation] = [x-μ]/σ
Confidence Interval(置信区间)
A confidence interval is a range of values around the expected outcome within which we expect the actual outcome to be some specified percentage of the time. A 95% confidence interval is a range that we expect the random variable to be in 95% of time. For a normal distribution, this interval is based on the expected value(sometimes called a point estimate) of the random variable and on its variability, which we measure with standard deviation.
Note: 1-confidence interval = α (which is called significance level)
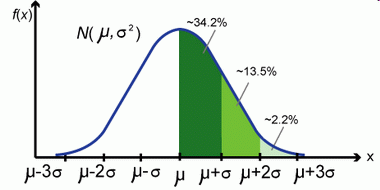
For any normally distributed random variable, 68% of outcomes are within one standard deviation of the expected value (mean), and approximately 95% of the outcomes are within two standard deviations of the expected value.
Shortfall risks, Safety-First ratio
Shortfall risk is the probability that a portfolio value or return will fall below a particular(target) value or return over a given time period.
Roy's safety-first criterion states that the optimal portfolio minimizes the probability that the return of the portfolio falls below some minimum acceptable level. This minimum acceptable level is called the threshold level.
If portfolio returns area normally distributed, then Roy's safety-first criterion can be stated as:

Note that the SFR is the number of standard deviations below the mean. Thus the portfolio with the larger SFR has the lower probability of returns below the threshold return.
Lognormal distribution(对数正太分布)
The lognormal distribution is generated by the function e^x, where x is normally distributed. Since the natural logarithm, ln, of e^x is x, the logarithms of lognormally distributed random variables are normally distributed.

- The log-normal distribution is skewed to the right
- The log-normal distribution is bounded from below by zero that it is useful for modeling asset prices which never take negative values.
PMF(Probability Mass Function)
PMF(概率质量函数),这个函数是值到其概率的映射。
如果要处理的数据比较少,PMF很合适。但随着数据的增加,每个值的概率就会降低,而随机噪声的影响就会增大。
CDF(Cumulative Distribution Function)
CDF(累积分布函数), 这个函数是值到其在分布中百分等级的映射。
  def Cdf(t, x):
     count = 0.0
     for value in t:
        if value <= x:
           count += 1.0
     prob = count / len(t)
     return prob
我们可以计算任意值x的CDF, 而不仅仅是样本中出现的值。如果x比样本中最小的值还要小,那么CDF(x)就等于0.如果x比样本中的最大值还要大,那么CDF(x)就是1.
帕累托分布
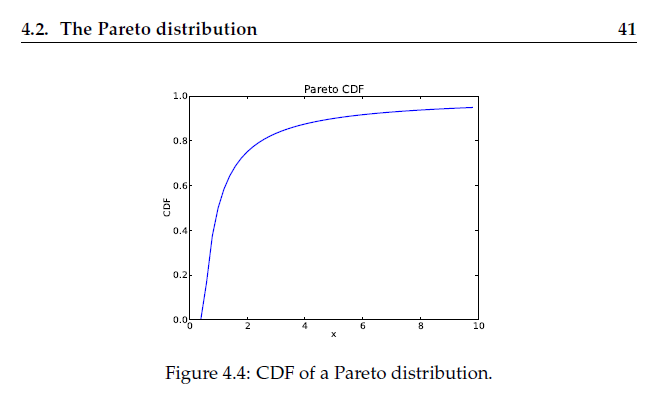
帕累托分布(Pareto distribution)是以意大利经济学家维弗雷多·帕雷托命名的。 是从大量真实世界的现象中发现的幂次定律分布。这个分布在经济学以外,也被称为布拉德福分布。
帕累托因对意大利20%的人口拥有80%的财产的观察而著名,后来被约瑟夫·朱兰和其他人概括为帕累托法则(80/20法则),后来进一步概括为帕累托分布的概念。
在帕累托分布中,如果X是一个随机变量, 则X的概率分布如下面的公式所示:

其中x是任何一个大于xmin的数,xmin是X最小的可能值(正数),k是为正的参数。帕累托分布曲线族是由两个数量参数化的:xmin和k。分布密度则为


