Resource:
Data Modeling Resource Center: http://infogoal.com/dmc/dmcdmd.htm
Data Warehousing Tutorial: http://www.infogoal.com/datawarehousing/
OLAP and Business Intelligence
If you want to analyze data, then On-Line Analytical Processing (OLAP) is often the best way to organize the data. OLAP organization provides several benefits:
(1) Fast
Data is organized for rapid query and analysis.
The database structure uses efficiency multidimensional or tuned relational approaches.
(2) Visual
Tools enable the analyst to navigate and view results through graphics such as: bar charts, pie charts and tree structures.
(3) Multidimensional
Supports "slicing and dicing" along multiple dimensions such as product, customer and location.
In addition, supports "pivot" / "cross tabs" where the investigator changes the direction of the analysis.
(4) Aggregation
Supports both drill down to details as well as roll up.
Some aggregations may be pre-calculated to save analysis time. This pre-calculation is where MOLAP provides value. See below.
(5) Time Series
Supports trend analysis. Most data marts include a calendar dimension. This dimension supports time hierarchies: year, quarter, month, week, day of week, and day.
(6) Ranking
Find the top, bottom or quartile members of a group, such as the top 10 most profitable products or the 10 lease profitable sales territories.
(7) Clusters and Outliers
Gain an understanding of groupings of items with common characteristics (clusters) as well as item with unusual characteristics (outliers).
(8) Complex Criteria
Gain an understanding of root causes and patterns by using complex criteria to look at meaningful slices of data.
OLAP Cubes Support Business Intelligence
OLAP helps to visualize data as cube structures.
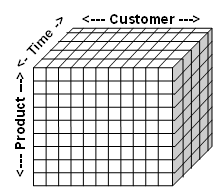
A cube is a multidimensional structure consisting of dimensions and measurements.
Cells are the points where dimensions intersect and contain the measurements.
Dimensions provide the context for analysis which are used for labels on reports and selection criteria for queries.
Dimensions answer questions like:
- Who (customers, employees, partners, ...)
- When (year, quarter, month, ...)
- What (products, contracts, ...)
- Where (state, zip code, territory, ...)
- How (method, process, formula, ...)
Cells supply quantitative information.
Cells answers questions like:
- How many (customer count, inventory count, ...)
- How much (revenue amount, budget amount, ...)
An atomic measurement is one that is stored at the lowest level, such as an individual sale or a single receipt of goods. The benefit of atomic data is that it supports detailed analysis and atomic data can be summed as needed. The drawbacks of atomic data are that it takes more space to store and it requires time to aggregate into totals for analysis.
Aggregated data is a summation of atomic data. For example, sales by quarter and rejects by month are aggregations. The benefit is that query and analysis time are reduced. The drawbacks are that analysis detail can be lost and it is difficult to predict which aggregations the analyst will want to use.
ROLAP Uses SQL for Business Intelligence
Relational OLAP (ROLAP) uses commonly available relational databases to support multidimensional analysis.
It has the advantages of:
- Use of widely available technology
- Availability of skilled personnel
Unfortunately, ROLAP has some disadvantages. These include:
- Lack of verbs to support cube operations
- Inefficient handling of empty cells ("sparse" data)
- Expense in pre-computing aggregates
Relational database vendors address some of these problems through the "Materialized View" which includes predefined joins and aggregations. This works well for cases where the joins and aggregations can be anticipated but falls down in cases where the need for aggregation can not be predicted. [—Ad hoc Query Support--] MOLAP was created to address those problems.
MOLAP Business Intelligence Benefits
Multidimensional OLAP (MOLAP) addresses problems of multiple aggregations, sparse data and effective cube handling. It provides these benefits:
- High scalability
- Controlled aggregations
- Data compression
- Distributed calculations
- Cubes that can be partitioned and distributed
The Multi-Dimensional eXpressions (MDX) language created by Microsoft has become a defacto OLAP standard. An industry group, XMLA.org, promotes this approach. Examples of systems that implement MDX include:
- Microsoft SQL Server Analysis Services (SSAS)
- Pentaho Business Intelligence Platform
Java OLAP (JOLAP) is an API that relies on the Common Warehouse Metamodel (CWM) standard. Oracle has implemented this standard at least in part.
HOLAP is Hybrid of ROLAP and MOLAP
The Hybrid OLAP is a combination of ROLAP and MOLAP. It seeks to create the "the best of both worlds".
===============================================================================