场景:
随着监控数据的增长,单个prometheus采集数据性能无法满足,即使100G+内存,也会出现OOM现象。
解决思路:
1.减少prometheus驻留内存的数据量,将数据持久化到tsdb或对象存储;
2.根据业务切割成多个prometheus,分模块存储数据。若需要进行多个promenade之间的汇聚,利用thanos的query实现。
搭建thanos前提假设:
1.已经安装docker和docker compose(本例子通过docker-compose进行安装部署)
2.通过2个prometheus验证thanos的可用性
安装步骤:
1.
#定义2个prometheus的存储路径
mkdir -p /home/dockerdata/prometheus

mkdir -p /home/dockerdata/prometheus2
#定义minio(用于对象存储)和docker-compose的路径
mkdir -p /home/dockerfile/thanos
mkdir -p /home/minio/data
2.minio配置文件(位于/home/dockerfile/thanos/bucket_config.yaml)
type: S3
config:
  bucket: "thanos"
  endpoint: 'minio:9000'
  access_key: "danny"
  insecure: true  #是否使用安全协议http或https
  signature_version2: false
  encrypt_sse: false
  secret_key: "xxxxxxxx" #设置s3密码,保证8位以上的长度
  put_user_metadata: {}
  http_config:
    idle_conn_timeout: 90s
    response_header_timeout: 2m
    insecure_skip_verify: false
  trace:
    enable: false
  part_size: 134217728
3.prometheus配置文件(位于/home/dockerfile/thanos/prometheus.yml和/home/dockerfile/thanos/prometheus2.yml)。有2个prometheus配置文件主要是区分端口和extends label。必须定义extends label,用于区分相同metrics的数据源
prometheus:
# my global config
global:
  scrape_interval:     15s # Set the scrape interval to every 15 seconds. Default is every 1 minute.
  evaluation_interval: 15s # Evaluate rules every 15 seconds. The default is every 1 minute.
  # scrape_timeout is set to the global default (10s).
  external_labels:
    monitor: 'danny-ecs'

# Alertmanager configuration
alerting:
  alertmanagers:
  - static_configs:
    - targets:
      # - alertmanager:9093

# Load rules once and periodically evaluate them according to the global 'evaluation_interval'.
rule_files:
  # - "first_rules.yml"
  # - "second_rules.yml"

# A scrape configuration containing exactly one endpoint to scrape:
# Here it's Prometheus itself.
scrape_configs:
  # The job name is added as a label `job=<job_name>` to any timeseries scraped from this config.
  - job_name: 'prometheus'

    # metrics_path defaults to '/metrics'
    # scheme defaults to 'http'.

    static_configs:
    #- targets: ['localhost:9090']
    - targets: ['node-exporter:9100']
prometheus2.yml
# my global config
global:
  scrape_interval:     15s # Set the scrape interval to every 15 seconds. Default is every 1 minute.
  evaluation_interval: 15s # Evaluate rules every 15 seconds. The default is every 1 minute.
  # scrape_timeout is set to the global default (10s).
  external_labels:
    monitor: 'prometheus2'

# Alertmanager configuration
alerting:
  alertmanagers:
  - static_configs:
    - targets:
      # - alertmanager:9093

# Load rules once and periodically evaluate them according to the global 'evaluation_interval'.
rule_files:
  # - "first_rules.yml"
  # - "second_rules.yml"

# A scrape configuration containing exactly one endpoint to scrape:
# Here it's Prometheus itself.
scrape_configs:
  # The job name is added as a label `job=<job_name>` to any timeseries scraped from this config.
  - job_name: 'prometheus'

    # metrics_path defaults to '/metrics'
    # scheme defaults to 'http'.

    static_configs:
    #- targets: ['localhost:9091']
    - targets: ['node-exporter:9100']
4.配置Dockerfile(docker-compose用到的,不确定是否必须。位于:/home/dockerfile/thanos)
FROM quay.io/prometheus/busybox:latest
LABEL maintainer="danny"

COPY /thanos_tmp_for_docker /bin/thanos

ENTRYPOINT [ "/bin/thanos" ]
5.docker-compose配置文件定义(基本所有内容都在这里了)
version: '2'
services:
  prometheus1:
    container_name: prometheus1
    image: prom/prometheus
    ports:
      - 9090:9090
    logging:
      driver: "json-file"
      options:
        max-size: "5m"
        max-file: "3"
    volumes:
    - /home/dockerdata/prometheus:/prometheus
    - /home/dockerfile/thanos/prometheus.yml:/etc/prometheus/prometheus.yml
    command:
      - --web.enable-lifecycle
      - --web.enable-admin-api
      - --config.file=/etc/prometheus/prometheus.yml
      - --storage.tsdb.path=/prometheus
      - --web.console.libraries=/usr/share/prometheus/console_libraries
      - --web.console.templates=/usr/share/prometheus/consoles
      - --storage.tsdb.min-block-duration=30m # small just to not wait hours to test :)
      - --storage.tsdb.max-block-duration=30m # small just to not wait hours to test :)
    depends_on:
    - minio

  sidecar1:
    container_name: sidecar1
    image: quay.io/thanos/thanos:v0.13.0-rc.2
    logging:
      driver: "json-file"
      options:
        max-size: "5m"
        max-file: "3"
    volumes:
    - /home/dockerdata/prometheus:/var/prometheus
    - /home/dockerfile/thanos/bucket_config.yaml:/bucket_config.yaml
    command:
    - sidecar
    - --tsdb.path=/var/prometheus
    - --prometheus.url=http://prometheus1:9090
    - --objstore.config-file=/bucket_config.yaml
    - --http-address=0.0.0.0:19191
    - --grpc-address=0.0.0.0:19090
    depends_on:
    - minio
    - prometheus1

  prometheus2:
    container_name: prometheus2
    image: prom/prometheus
    ports:
      - 9091:9090
    logging:
      driver: "json-file"
      options:
        max-size: "5m"
        max-file: "3"
    volumes:
    - /home/dockerdata/prometheus2:/prometheus
    - /home/dockerfile/thanos/prometheus2.yml:/etc/prometheus/prometheus.yml
    command:
      - --web.enable-lifecycle
      - --web.enable-admin-api
      - --config.file=/etc/prometheus/prometheus.yml
      - --storage.tsdb.path=/prometheus
      - --web.console.libraries=/usr/share/prometheus/console_libraries
      - --web.console.templates=/usr/share/prometheus/consoles
      - --storage.tsdb.min-block-duration=30m
      - --storage.tsdb.max-block-duration=30m
    depends_on:
    - minio

  sidecar2:
    container_name: sidecar2
    image: quay.io/thanos/thanos:v0.13.0-rc.2
    logging:
      driver: "json-file"
      options:
        max-size: "5m"
        max-file: "3"
    volumes:
    - /home/dockerdata/prometheus2:/var/prometheus
    - /home/dockerfile/thanos/bucket_config.yaml:/bucket_config.yaml
    command:
    - sidecar
    - --tsdb.path=/var/prometheus
    - --prometheus.url=http://prometheus2:9090
    - --objstore.config-file=/bucket_config.yaml
    - --http-address=0.0.0.0:19191
    - --grpc-address=0.0.0.0:19090
    depends_on:
    - minio
    - prometheus2

  grafana:
    container_name: grafana
    image: grafana/grafana
    ports:
    - "3000:3000"

  # to search on old metrics
  storer:
    container_name: storer
    image: quay.io/thanos/thanos:v0.13.0-rc.2
    volumes:
    - /home/dockerfile/thanos/bucket_config.yaml:/bucket_config.yaml
    command:
    - store
    - --data-dir=/var/thanos/store
    - --objstore.config-file=bucket_config.yaml
    - --http-address=0.0.0.0:19191
    - --grpc-address=0.0.0.0:19090
    depends_on:
    - minio

  # downsample metrics on the bucket
  compactor:
    container_name: compactor
    image: quay.io/thanos/thanos:v0.13.0-rc.2
    volumes:
    - /home/dockerfile/thanos/bucket_config.yaml:/bucket_config.yaml
    command:
    - compact
    - --data-dir=/var/thanos/compact
    - --objstore.config-file=bucket_config.yaml
    - --http-address=0.0.0.0:19191
    - --wait
    depends_on:
    - minio

  # querier component which can be scaled
  querier:
    container_name: querier
    image: quay.io/thanos/thanos:v0.13.0-rc.2
    labels:
    - "traefik.enable=true"
    - "traefik.port=19192"
    - "traefik.frontend.rule=PathPrefix:/"
    ports:
    - "19192:19192"
    command:
    - query
    - --http-address=0.0.0.0:19192
    - --store=sidecar1:19090
    - --store=sidecar2:19090
    - --store=storer:19090
    - --query.replica-label=replica

  minio:
    image: minio/minio:latest
    container_name: minio
    ports:
      - 9000:9000
    volumes:
      - "/home/minio/data:/data"
    environment:
      MINIO_ACCESS_KEY: "danny"
      MINIO_SECRET_KEY: "xxxxxxxx" #输入8位以上的密码
    command: server /data
    restart: always
    logging:
      driver: "json-file"
      options:
        max-size: "5m"
        max-file: "3"

  node-exporter:
    image: prom/node-exporter:latest
    container_name: node-exporter
    ports:
      - '9100:9100'
6.启动。第一次up的时候,storer会启动失败,需要单独重启一次storer
cd /home/dockerfile/thanos
docker-compose up -d
docker-compose up -d storer
7.验证
docker ps -a
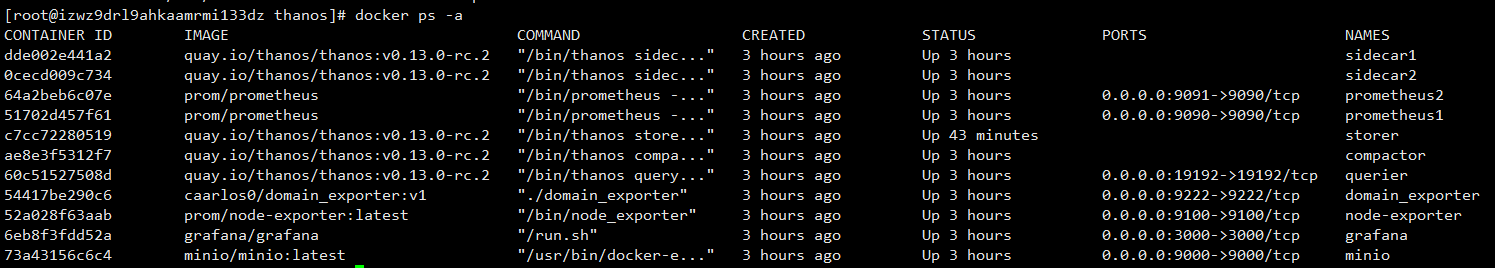
证明所有容器已经启动成功
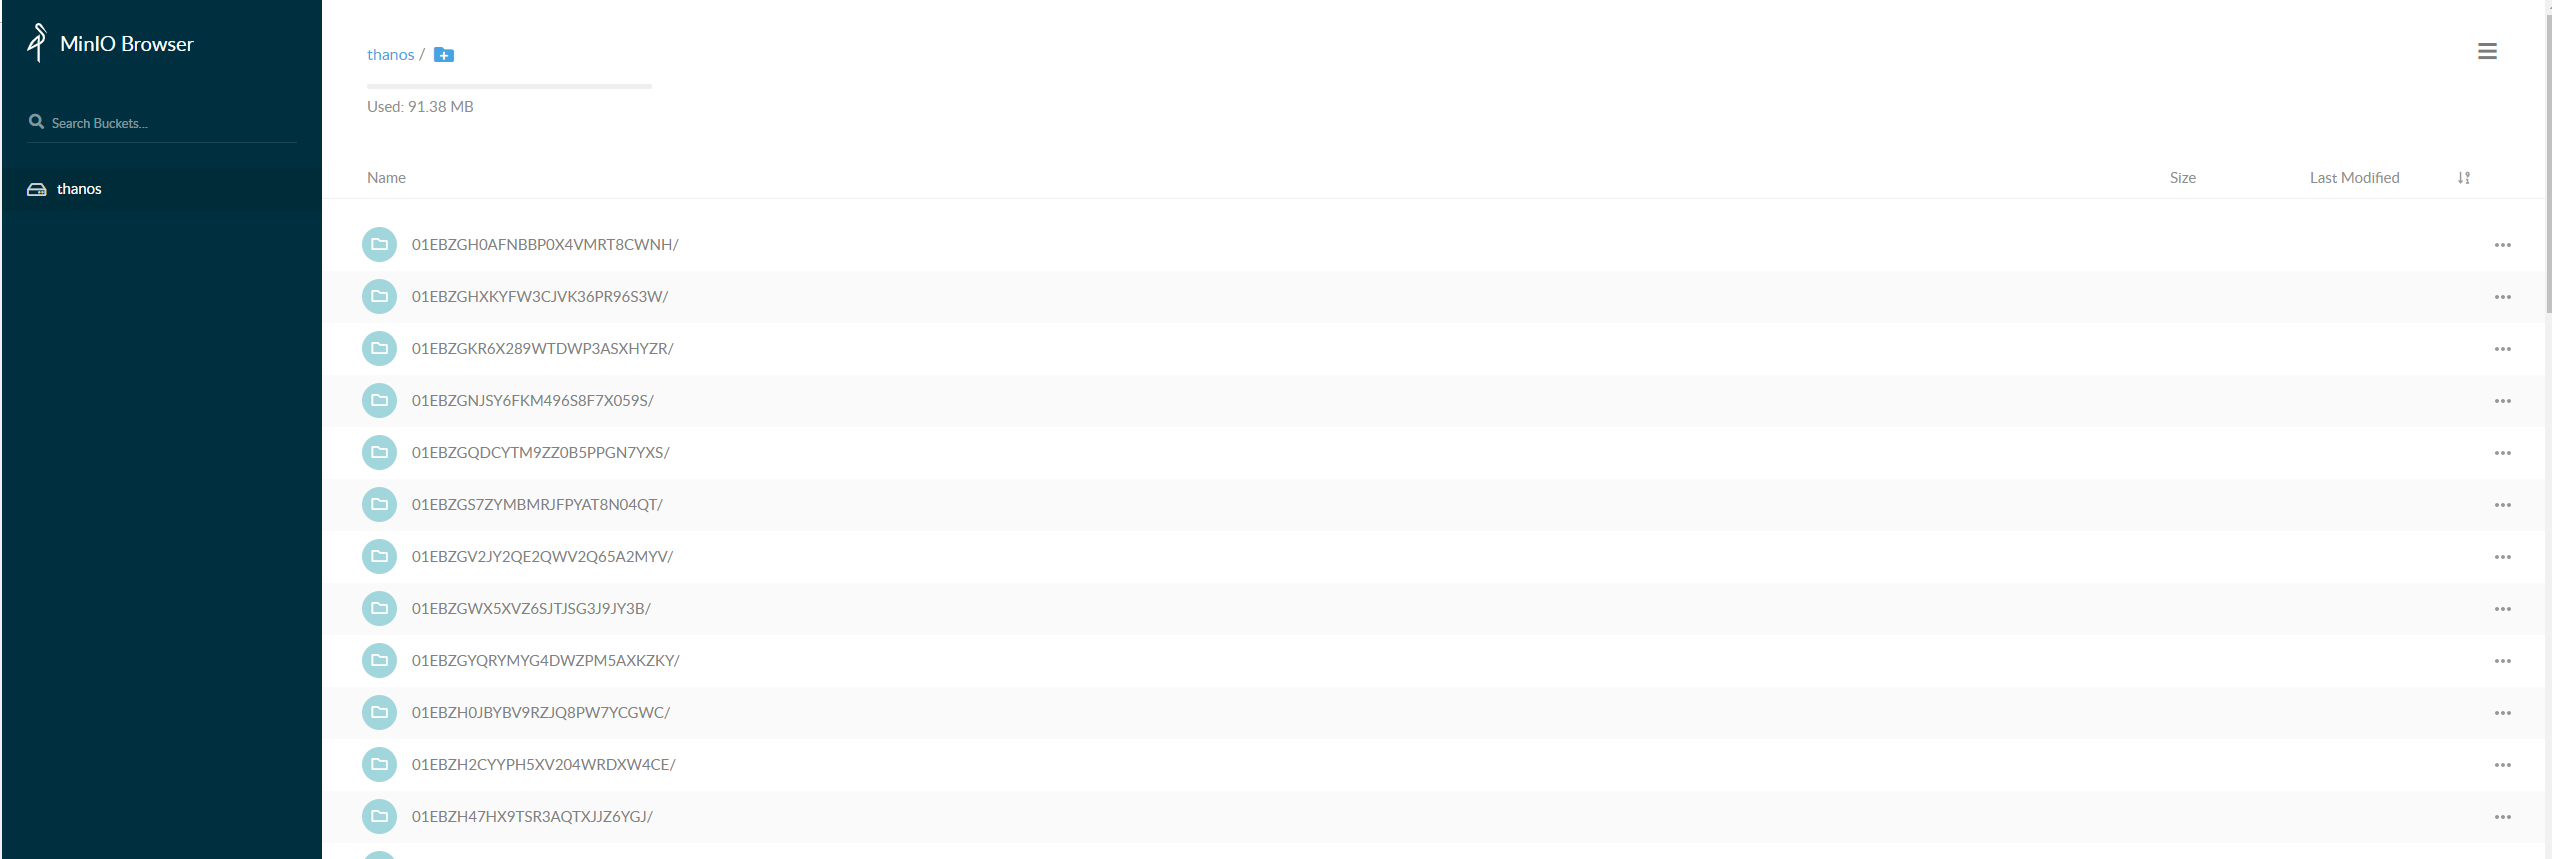
8.promenade 的block数据成功上传到minio验证
访问地址:http://ip:9000/minio/login
账号密码在bucket_config.yaml中定义的
创建bucket:thanos
如果正常运行,block数据会成功上传到thanos这个bucket(即sidecar组建安装成功):
9.验证query组建和store组建是否安装成功。
访问query页面(跟promenade的页面基本一致)
输入metrices:node_uname_info

安装部署参考链接:https://www.cnblogs.com/rongfengliang/p/11319933.html
对thanos架构理解参考链接:http://www.dockone.io/article/10035