• 《西瓜书》第四章,决策树2:连续值,缺失值,画图


    ▶ 继续改进决策树的代码,对连续型变量和含缺失值的变量进行分类,以及画图的代码(头一回采用递归的画图,Python 的 plt 到处随便调不用考虑句柄传递的问题,很爽)。

    ● 代码,仅注释了与简单决策树不同的地方

      1 import numpy as np
      2 import matplotlib.pyplot as plt
      3 import operator
      4 import warnings
      5 
      6 warnings.filterwarnings("ignore")                           
      7 dataSize = 1000
      8 trainRatio = 0.3
      9 randomSeed = 107
     10 
     11 def dataSplit(data, part):                                  
     12     return data[0:part], data[part:]
     13 
     14 def kernel(x, i, n):                                                                    # 用来分类的分段函数
     15     return np.select([x < 1-i/n, True], [i*x/(n-i), n*(x-1)/i-x+2])
     16 
     17 def createData(dim, kind, len):                                                         # 取连续值,没有 option 选项
     18     np.random.seed(randomSeed)        
     19     temp = np.random.rand(len, dim)
     20     x = np.sum(temp[:,:-1],1) / (dim - 1)    
     21     if kind == 2:                                                                       
     22         f = temp[:,-1] > x * (32 / 3 * (x-1) * (x-1/2) + 1)                             # 过 (0,0),(1/4,3/4),(1/2,1/2),(1,1) 的三次曲线        
     23     elif kind == 3:
     24         f = (temp[:,-1] > x ** 2).astype(int) + (temp[:,-1] > 1 - (1-x)**2).astype(int) # 把单位正方形三等分了的两条抛物线        
     25     else:   
     26         f = np.zeros(len)                                                               
     27         fi = np.frompyfunc(kernel, 3, 1)                                                # 让 kernel 能接受向量输入
     28         for i in range(1, kind):                                                        # 在单位正方形不过原点的对角线上等距取点
     29             f += temp[:,-1] > fi(x,i,kind).astype(float)                                # 分别连接 (0,0) 和 (1,1),划分区域
     30         
     31     output = [ temp[i].tolist() + [str(f[i])] for i in range(len) ]
     32     label = [ chr(i + 65) for i in range(dim) ]
     33     #for line in output:
     34     #    print(line)
     35     print("dim = %d, kind = %d, dataSize = %d, weightedMean = %4f"%(dim, kind, dataSize, np.sum(f.astype(int)) / (len *(kind-1))))    
     36     return output, label
     37 
     38 def plogp(x, isScalar):                                 
     39     output = x * np.log2(x)
     40     if isScalar:
     41         return [0 if np.isnan(output) else output][0]
     42     output[np.isnan(output)] = 0.0
     43     return output
     44 
     45 def calculateGain(table, alpha = 0):                                                    # 公式跟离散情形一模一样                    
     46     sumC = np.sum(table, 0)                             
     47     sumR = np.sum(table, 1)                             
     48     sumA = np.sum(sumC)                                 
     49     temp = -( np.sum(plogp(sumC,False)) - plogp(sumA,True) - np.sum(plogp(table,False)) + np.sum(plogp(sumR,False)) ) / sumA
     50     if alpha == 0:
     51         return temp
     52     elif alpha == 1:        
     53         return temp * (-1.0 / np.sum(plogp(sumR / sumA,False)))
     54     else:
     55         return sumA / ( np.sum(sumR * (1 - np.sum(table * table, 0) / (sumR * sumR))) ) 
     56 
     57 def chooseFeature(data,label):                                              
     58     size, dim = np.shape(data)
     59     dim -= 1    
     60     realMaxGain = 0  
     61     realPoint = -1
     62     maxi = -1            
     63     kindTable = list(set([ data[j][-1] for j in range(size) ]))
     64     for i in range(dim):                                                    
     65         valueTable = [ data[j][i] for j in range(size) ]
     66         sortedValueTable = sorted(valueTable)
     67         tSet = [ (sortedValueTable[i] + sortedValueTable[i+1])/2 for i in range(size-1)]# 分点集合               
     68         maxGain = 0
     69         point = -1
     70         for t in tSet:                                                                  # 尝试每个分点
     71             table = np.zeros([2,2],dtype=int)              
     72             for j in range(size):
     73                 table[int(data[j][-1] == kindTable[0]),int(data[j][i] < t)] += 1
     74             gain = calculateGain(table)                                         
     75             if (gain > maxGain):                                                        # 内部关于 t 找一次最大值
     76                 maxGain = gain
     77                 point = t    
     78         if (maxGain > realMaxGain):                                                     # 外部关于 i 找一次最大值
     79             realMaxGain = maxGain
     80             maxi = i
     81             realPoint = point                        
     82     return (maxi, realPoint)                                                            # 不再返回最佳属性的取值表,而是返回分点
     83 
     84 def vote(kindList):                                                         
     85     kindCount = {}
     86     for i in kindList:
     87         if i not in kindCount.keys():
     88             kindCount[i] = 0
     89         kindCount[i] += 1    
     90     output = sorted(kindCount.items(),key=operator.itemgetter(1),reverse = True)    
     91     return output[0][0]                                                             
     92             
     93 def createTree(data,label):                                                         
     94     #if data == []:                                  
     95     #    return '?'                          
     96     if len(data[0]) == 1:                           
     97         return vote([ line[-1] for line in data ])
     98     classList = set([i[-1] for i in data])          
     99     if len(classList) == 1:                         
    100         return list(classList)[0]
    101         
    102     bestFeature, point = chooseFeature(data, label)            
    103     bestLabel = label[bestFeature]                                  
    104     myTree = {(bestLabel,point):{}}                                  # 树中属性节点,附上分点数据                                                 
    105     
    106     childData = []                                                   # 分左右两半进行递归,0 表示小于分点的数据,1 表示大于分点的数据
    107     for line in data:                                                # 只有两个分支,做循环展开
    108         if line[bestFeature] <= point:                                          
    109             childData.append(line)
    110     myTree[(bestLabel,point)][0] = createTree(childData, label)    
    111     childData = []                                               
    112     for line in data:                                           
    113         if line[bestFeature] > point:                                          
    114             childData.append(line)
    115     myTree[(bestLabel,point)][1] = createTree(childData, label)
    116     return myTree
    117 
    118 def draw(xMin, xMax, yMin, yMax, nowTree,kindType):   
    119     #plt.plot([xMin,xMax],[yMin,yMin],color=[1,1,1])
    120     #plt.plot([xMin,xMax],[yMax,yMax],color=[1,1,1])
    121     #plt.plot([xMin,xMin],[yMin,yMax],color=[1,1,1])
    122     #plt.plot([xMax,xMax],[yMin,yMax],color=[1,1,1])
    123     direction,value = list(nowTree)[0]        
    124     if(direction)=='A':                                                     # 画竖线
    125         plt.plot([value,value],[yMin,yMax],color=[0,0,0])        
    126         branch0,branch1 = list(nowTree.values())[0].values()
    127         if type(branch0) == kindType:                                       # 左支
    128             plt.text((xMin+value)/2,(yMin+2*yMax)/3, str(branch0[0]), 
    129                 size = 9, ha="center", va="center", bbox=dict(boxstyle="round", ec=(1., 0.5, 0.5), fc=(1., 1., 1.)))
    130         else:
    131             draw(xMin, value, yMin, yMax, branch0, kindType)
    132         if type(branch1) == kindType:                                       # 右支
    133             plt.text((xMax+value)/2,(2*yMin+yMax)/3, str(branch1[0]), 
    134                 size = 9, ha="center", va="center", bbox=dict(boxstyle="round", ec=(1., 0.5, 0.5), fc=(1., 1., 1.)))
    135         else:
    136             draw(value, xMax, yMin, yMax, branch1, kindType)
    137     else:                                                                   # 画横线
    138         plt.plot([xMin,xMax],[value,value],color=[0,0,0])
    139         branch0,branch1 = list(nowTree.values())[0].values()
    140         if type(branch0) == kindType:                                       # 下支
    141             plt.text((xMin+2*xMax)/3,(yMin+value)/2, str(branch0[0]), 
    142                 size = 9, ha="center", va="center", bbox=dict(boxstyle="round", ec=(1., 0.5, 0.5), fc=(1., 1., 1.)))
    143         else:
    144             draw(xMin, xMax, yMin, value, branch0, kindType)
    145         if type(branch1) == kindType:                                       # 上支
    146             plt.text((2*xMin+xMax)/3,(yMax+value)/2, str(branch1[0]), 
    147                 size = 9, ha="center", va="center", bbox=dict(boxstyle="round", ec=(1., 0.5, 0.5), fc=(1., 1., 1.)))
    148         else:
    149             draw(xMin, xMax, value, yMax, branch1, kindType)    
    150 
    151 def test(dim, kind):                                                
    152     allData, labelName = createData(dim, kind, dataSize)            
    153     trainData, testData = dataSplit(allData, int(dataSize * trainRatio)) 
    154     outputTree = createTree(trainData, labelName)                           
    155     print(outputTree)                                                      
    156     
    157     myResult = []                                       
    158     #count = 0                                          
    159     for line in testData:
    160         #print(count)
    161         tempTree = outputTree                           
    162         while(True):                                                        
    163             judgeName = list(tempTree)[0]
    164             judgeValue = list(tempTree.values())[0]            
    165             value = line[labelName.index(judgeName[0])]        # 取属性节点的属性名                
    166             resultNow = judgeValue[int(value > judgeName[1])]  # 取属性节点的分点值来做比较
    167             if type(resultNow) == type(allData[0][-1]):
    168                 myResult.append(resultNow)
    169                 break
    170             tempTree = resultNow    
    171         #count+=1
    172 
    173     fig = plt.figure(figsize=(10, 8))    
    174     plt.xlim(0.0,1.0)
    175     plt.ylim(-0.0,1.0)
    176     xT = []
    177     xF = []
    178     yT = []
    179     yF = []
    180     for i in range(len(testData)):
    181         if testData[i][-1] == 'True':
    182             xT.append(testData[i][0])            
    183             yT.append(testData[i][1])
    184         else:
    185             xF.append(testData[i][0])
    186             yF.append(testData[i][1])        
    187     plt.scatter(xT,yT,color=[1,0,0],label = "classT")
    188     plt.scatter(xF,yF,color=[0,0,1],label = "classF")
    189     plt.legend(loc=[0.85, 0.1], ncol=1, numpoints=1, framealpha = 1)
    190     draw(0.0,1.0,0.0,1.0,outputTree,type(allData[0][-1]))    
    191     fig.savefig("R:\dim" + str(dim) + ".png")
    192     plt.close()
    193     print("errorRatio = %4f"%( sum(map(lambda x,y:int(x!=y[-1]), myResult, testData)) / (dataSize*(1-trainRatio)) ))    
    194 
    195 if __name__=='__main__':    
    196     test(2, 2)           
    197     #test(2, 2)
    198     #test(3, 2)
    199     #test(4, 2)    

    ● 输出结果(数字精度砍掉了,不然太长了)

    {('B',0.3032): {0: {('A',0.0408): {0: {('A',0.0352): {0: 'False',
                                                          1: 'True'
                                                         }
                                          },
                                       1: 'False'
                                      }
                       },
                    1: {('B',0.6816): {0: {('A',0.5020): {0: {('A',0.0797): {0: {('B',0.3171): {0: 'False',
                                                                                                1: 'True'
                                                                                               }
                                                                                },
                                                                             1: {('B',0.6223): {0: {('A',0.4835): {0: 'False',
                                                                                                                   1: {('A',0.4932): {0: 'True',
                                                                                                                                      1: 'False'
                                                                                                                                     }
                                                                                                                      }
                                                                                                                  }
                                                                                                   },
                                                                                                1: {('A',0.3897): {0: {('A',0.1309): {0: 'True',
                                                                                                                                      1: 'False'
                                                                                                                                     }
                                                                                                                      },
                                                                                                                   1: 'True'
                                                                                                                  }
                                                                                                   }
                                                                                               }
                                                                                }
                                                                            }
                                                             },
                                                          1: {('A',0.9160): {0: {('A',0.5407): {0: {('A',0.5327): {0: 'True',
                                                                                                                   1: 'False'
                                                                                                                  }
                                                                                                   },
                                                                                                1: 'True'
                                                                                               }
                                                                                },
                                                                             1: 'False'
                                                                            }
                                                             }
                                                         }
                                          },
                                       1: {('A',0.9450): {0: {('B',0.7335): {0: {('B',0.7262): {0: 'True',
                                                                                                1: 'False'
                                                                                               }
                                                                                },
                                                                             1: 'True'
                                                                            }
                                                             },
                                                          1: 'False'
                                                         }
                                          }
                                      }
                       }
                   }
    }
     errorRatio = 0.054286
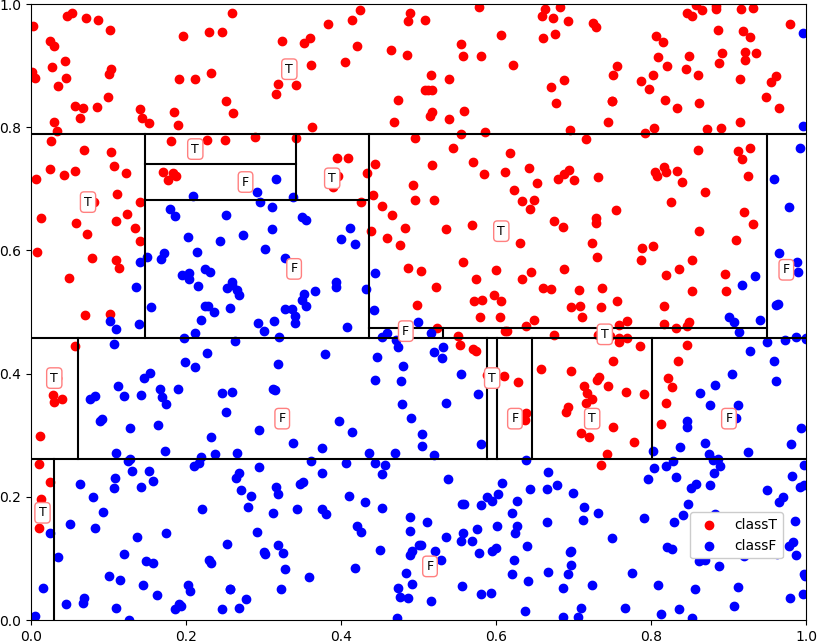
    ● 画图

     ● 有缺失值时,在函数 chooseFeature 中为表格 table 增加一行来保存分属各类别的样本频数,带入以下函数中计算增益

     1 def calculateGain(table, alpha = 0):                                                    # 有缺失值情况,table 多一行来保存分属各类别的样本频数
     2     sumC = np.sum(table[:-1], 0)                                                        # 行列求和不包括缺失值的行
     3     sumR = np.sum(table[:-1], 1)
     4     sumA = np.sum(sumC)
     5     temp = -( np.sum(plogp(sumC,False)) - plogp(sumA,True) - np.sum(plogp(table,False)) + np.sum(plogp(sumR,False)) ) / (sumA + np.sum(table[-1]))  # 总分母要算上缺失行的频数,就算是乘以了 ρ  
     6     if alpha == 0:
     7         return temp
     8     elif alpha == 1:
     9         return temp * (-1.0 / np.sum(plogp(sumR / sumA,False)))
    10     else:
    11         return sumA / ( np.sum(sumR * (1 - np.sum(table * table, 0) / (sumR * sumR))) )

     ● 留坑,类别数大于 2 时的的画图函数

  • 相关阅读:
    html调用php
    MySQL安装下载
    MySQL默认安装下载
    MySQL安装下载
    搭建php环境
    面试官:聊聊对Vue.js框架的理解
    TCP、UDP、HTTP、SOCKET之间的区别与联系
    HTTP/1、HTTP/2、HTTP/3
    git教程
    从jQuery到Serverless,前端十四年挖了多少坑?
  • 原文地址:https://www.cnblogs.com/cuancuancuanhao/p/11126556.html
Copyright © 2020-2023  润新知