<template>
<div class="echarts">
<IEcharts :option="pie" @ready="onReady" @click="onClick"></IEcharts>
<button @click="test">go</button>
</div>
</template>
<script>
import IEcharts from 'vue-echarts-v3/src/lite.js';
import 'echarts/lib/component/title'; //引入标题组件
import 'echarts/lib/component/legend'; //引入图例组件
import 'echarts/lib/component/tooltip'; //引入图例组件
import 'echarts/lib/chart/bar';
// import func from './vue-temp/vue-editor-bridge';
export default {
components: {IEcharts},
data: () => ({
pie: {
color: ['#3398DB'],
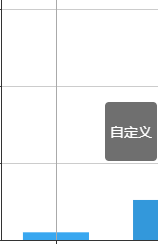
tooltip : {
trigger: 'axis',
formatter:function (params){
console.log(params[0].name)
let res ='<p>'+params[0].data.name+'</p>'
return res
}
},
grid: {
left: '3%',
right: '4%',
bottom: '3%',
containLabel: true
},
xAxis : [
{
type : 'category',
data : ['Mon', 'Tue', 'Wed', 'Thu', 'Fri', 'Sat', 'Sun'],
axisTick: {
alignWithLabel: true
}
}
],
yAxis : [
{
type : 'value'
}
],
series : [
{
name:'直接访问',
type:'bar',
barWidth: '60%',
data:[{name:'自定义',value:10}, 52, 200, 334, 390, 330, 220]
}
]
}
}),
methods: {
onReady(instance) {
console.log(instance);
},
onClick(event, instance, echarts) {
console.log(arguments);
},
test () {
this.$router.push('/HelloWorld1')
}
}
};
</script>
<style scoped>
.echarts{
100%;
height: 400px;
margin: auto;
text-align: center;
}
</style>