在“JavaScript图形实例:曲线方程”一文中,我们给出了15个曲线方程绘制图形的实例。这些曲线都是根据其曲线方程,在[0,2π]区间取一系列角度值,根据给定角度值计算对应的各点坐标,然后在计算出的坐标位置描点,从而绘制出曲线。
我们可以将曲线的绘制过程动态展示出来。
例如,对于星形线的绘制,编写如下的HTML代码。
<!DOCTYPE>
<html>
<head>
<title>星形线的绘制</title>
</head>
<body>
<canvas id="myCanvas" width="300" height="300" style="border:3px double #996633;">
</canvas>
<script>
var canvas = document.getElementById('myCanvas');
var ctx = canvas.getContext('2d');
ctx.clearRect(0,0,300,300);
var theta=0;
var dig=Math.PI/256;
function motion()
{
ctx.beginPath();
var x = 80*Math.cos(theta)*Math.cos(theta)*Math.cos(theta)+150;
var y = 80*Math.sin(theta)*Math.sin(theta)*Math.sin(theta)+150;
ctx.arc(x,y, 3, 0, 2 * Math.PI);
ctx.closePath();
ctx.fillStyle = "red";
ctx.fill();
theta=theta+dig;
if (theta>2*Math.PI)
{
theta=0;
ctx.clearRect(0,0,300,300);
}
}
setInterval('motion()',20);
</script>
</body>
</html>
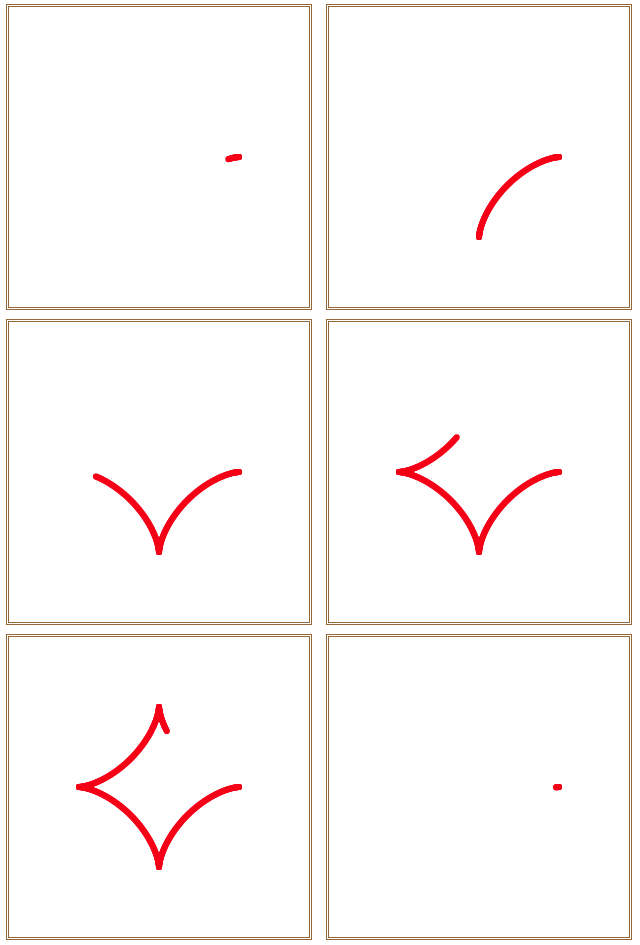
在浏览器中打开包含这段HTML代码的html文件,可以在浏览器窗口中看到星形线的动态绘制过程,如图1所示。

图1 星形线的绘制
将上面程序中的语句
var x = 80*Math.cos(theta)*Math.cos(theta)*Math.cos(theta)+150;
var y = 80*Math.sin(theta)*Math.sin(theta)*Math.sin(theta)+150;
改写为:
x = 8*(16*Math.pow(Math.sin(theta),3))+150;
y= 150-8*(13*Math.cos(theta)-5*Math.cos(2*theta)-2*Math.cos(3*theta)-Math.cos(4*theta));
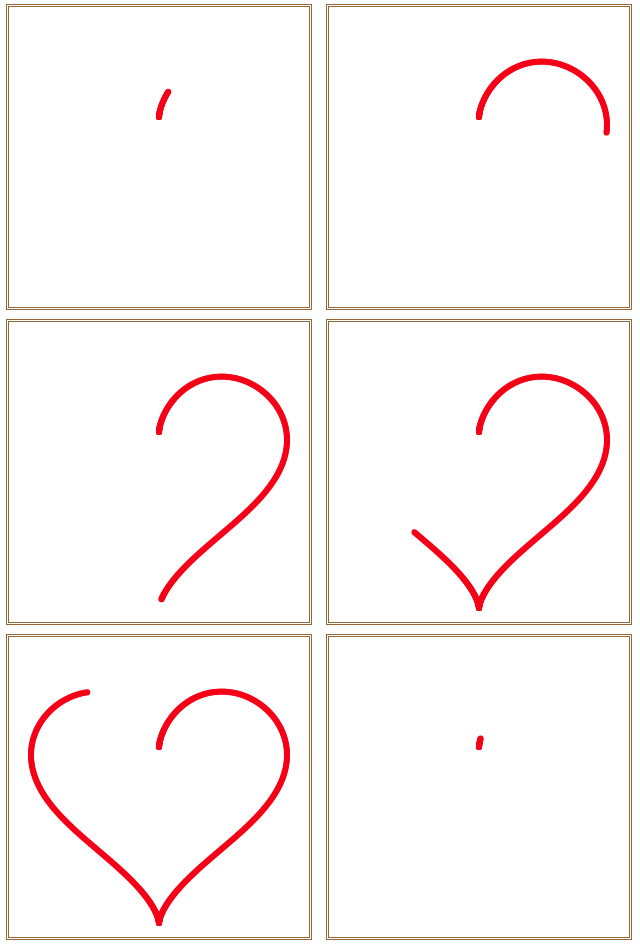
就可以在画布中看到如图2所示的心型线的动态绘制过程。

图2 心型线的绘制
对于更多的曲线,均可以如同心型线一样,根据其参数方程,适当修改坐标位置(x,y)的计算语句即可。
为此,编写如下的HTML代码。
<!DOCTYPE>
<html>
<head>
<title>曲线的绘制</title>
</head>
<body>
<canvas id="myCanvas" width="300" height="300" style="float:left;border:3px double #996633;">
</canvas>
<form><br/>
<input id="R1" name="spiral" type="radio" checked onclick="go()" />星形线<br/><br/>
<input id="R2" name="spiral" type="radio" onclick="go()" />心型线<br/><br/>
<input id="R3" name="spiral" type="radio" onclick="go()" />玫瑰线<br/><br/>
<input id="R4" name="spiral" type="radio" onclick="go()" />太阳线<br/><br/>
<input id="R5" name="spiral" type="radio" onclick="go()" />六瓣花型线<br/><br/>
</form>
<script>
var canvas = document.getElementById('myCanvas');
var ctx = canvas.getContext('2d');
var a=0;
function motion()
{
if(document.getElementById('R1').checked)
{
dig=Math.PI/128;
x = 80*Math.cos(a)*Math.cos(a)*Math.cos(a)+150;
y = 80*Math.sin(a)*Math.sin(a)*Math.sin(a)+150;
}
if(document.getElementById('R2').checked)
{
dig=Math.PI/128;
x = 8*(16*Math.pow(Math.sin(a),3))+150;
y= 150-8*(13*Math.cos(a)-5*Math.cos(2*a)-2*Math.cos(3*a)-Math.cos(4*a));
}
if(document.getElementById('R3').checked)
{
dig=Math.PI/400;
x=150+100 * Math.sin(4*a)*Math.cos(a);
y=150+100 * Math.sin(4*a)*Math.sin(a);
}
if(document.getElementById('R4').checked)
{
dig=Math.PI/720;
r=15*Math.cos(30*a)+12;
x = 150+5*r*Math.cos(a);
y = 150+5*r*Math.sin(a);
}
if(document.getElementById('R5').checked)
{
dig=Math.PI/512;
r=100*(1+Math.sin(18*a)/5)*(0.5+Math.sin(6*a)/2);
x=150+r*Math.cos(a);
y=150+r*Math.sin(a);
}
ctx.beginPath();
ctx.arc(x,y,2,0, 2 * Math.PI);
ctx.closePath();
ctx.fillStyle = "red";
ctx.fill();
a=a+dig;
if (a>2*Math.PI)
{
a=0;
ctx.clearRect(0,0,300,300);
}
}
function go()
{
ctx.clearRect(0,0,400,300);
a=0;
setInterval('motion()',30);
}
go();
</script>
</body>
</html>
在浏览器中打开包含这段HTML代码的html文件,可以在浏览器窗口中看到5种曲线绘制的动画效果,如图3所示。更多曲线的绘制,大家可以根据选定的曲线方程自行添加相应代码即可。

图3 曲线绘制动画