http://www.builder.com.cn/2007/1008/539473.shtml
微软今天公布了一项开放源代码计划,随着Visual Studio 2008的发布,微软将根据Microsoft Reference License向开发人员提供Microsoft.NET架构的源代码,包括基础类库 (System namespace, IO, Text, Collections, CodeDom, Regular Expressions, etc), ASP.NET, WinForms以及WPF,并且微软还会逐渐开放更多产品.
我们有两种方法可以读到源代码:
1) 下载源码包,并在本地安装和阅览.
2) VS 2008 整合将允许开发者参与从自己的源代码到 .NET Framework源代码的调试,微软将提供互联网可访问的源代码服务器.
 查看: Want to see the .NET Framework source code?
Releasing the Source Code for the .NET Framework Libraries
One of the things my team has been working to enable has been the ability for .NET developers to download and browse the source code of the .NET Framework libraries, and to easily enable debugging support in them.
Today I'm excited to announce that we'll be providing this with the .NET 3.5 and VS 2008 release later this year.
We'll begin by offering the source code (with source file comments included) for the .NET Base Class Libraries (System, System.IO, System.Collections, System.Configuration, System.Threading, System.Net, System.Security, System.Runtime, System.Text, etc), ASP.NET (System.Web), Windows Forms (System.Windows.Forms), ADO.NET (System.Data), XML (System.Xml), and WPF (System.Windows). We'll then be adding more libraries in the months ahead (including WCF, Workflow, and LINQ). The source code will be released under the Microsoft Reference License (MS-RL).
You'll be able to download the .NET Framework source libraries via a standalone install (allowing you to use any text editor to browse it locally). We will also provide integrated debugging support of it within VS 2008.
Integrated Visual Studio 2008 Debugging Support
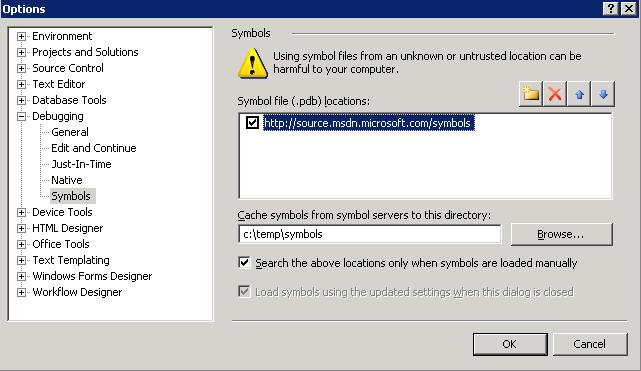
The final release of VS 2008 will support the ability to configure the debugger to dynamically download the .NET Framework debugger symbols (and corresponding source code) from a web server hosted by Microsoft. You'll be able to configure the .NET Framework symbols to be downloaded all in one shot, or manually retrieved on demand:
When you debug a .NET application and hit a breakpoint in your code, you'll now be able to see a debugger call stack that contains detailed file and line number information for the .NET Framework classes and methods in your application:
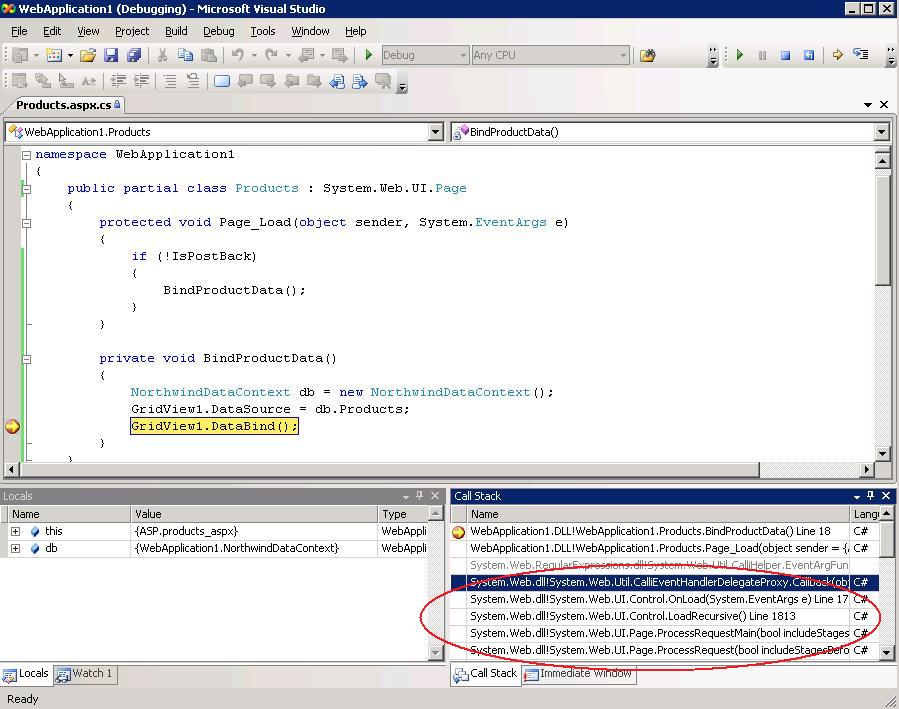
In the screen-shot above, you can see that we've set a debugger breakpoint in my page where we are calling GridView1.DataBind(). Previously there was no way to drill into this DataBind() method to see how it was implemented.
Now with VS 2008 you'll be able to press F11 ("Step Into") and drill into the .NET Framework source implementation with the debugger:
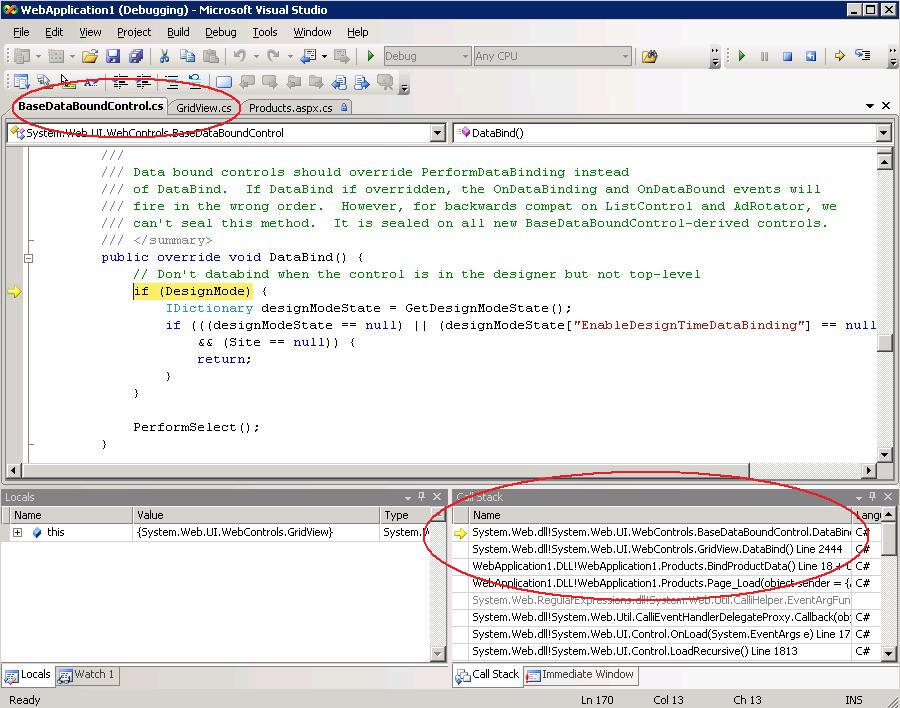
VS 2008 will include support to automatically retrieve the appropriate .NET Framework source files on demand from Microsoft. This means that the source code for the ASP.NET GridView and BaseDataBoundControl classes above do not have to already be installed on the machine before we started the debugger. Instead, when we use F11 to step into their implementation VS can automatically download the source files from Microsoft and open it within the IDE.
By downloading the files dynamically we can also ensure that the matching source files always line-up with the particular version of the .NET Framework on your machine (for example: if you have a GDR or Service Pack Patch installed on your machine, we'll make sure to download the source file that corresponds to it).
In addition to stepping into .NET Framework code, we can also step back up on the call stack into .NET Framework source as well. For example, in our scenario above I could also double click up the callstack and review the private ProcessRequest method on the System.Web.UI.Page class:
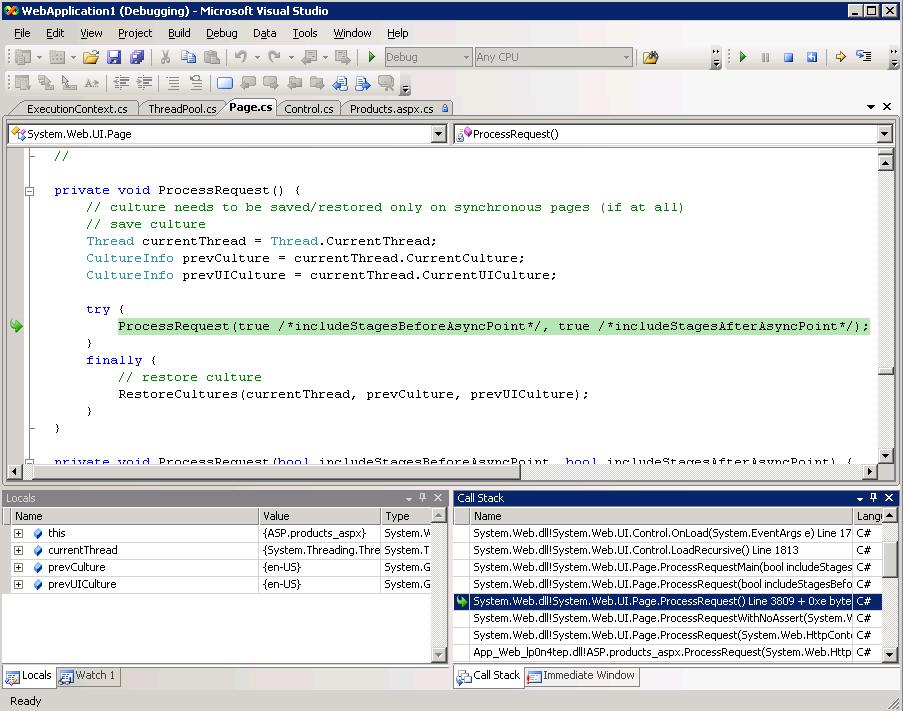
We could optionally also step further up and into the System.Threading.ThreadPool implementation in mscorlib (which controls the thread our Page is scheduled on):
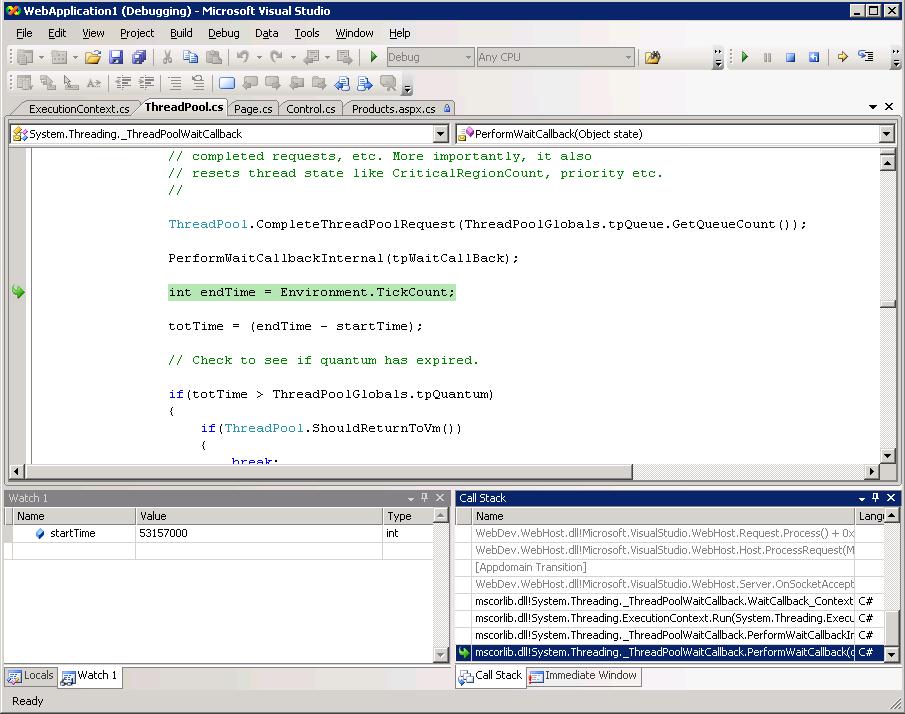
Note in the previous two screen-shots how the VS debugger's "Locals" and "Watch" windows are fully supported within both your code as well as in the .NET Framework source.
Summary
Having source code access and debugger integration of the .NET Framework libraries is going to be really valuable for .NET developers. Being able to step through and review the source should provide much better insight into how the .NET Framework libraries are implemented, and in turn enable developers to build better applications and make even better use of them.
To learn more about our source release plans and how the above debugger integration works, please check out this Podcast that Scott Hanselman and Shawn Burke recently recorded. Shawn (who drove the source project on my team) is also going to be publishing a cool Channel9 video later this week that shows using the VS 2008 integrated debugging support with it.
Hope this helps,
Scott