数据源:https://tianchi.aliyun.com/competition/entrance/231715/information
首先要将用到的模块导入进去:
import pandas as pd
import numpy as np
import matplotlib.pyplot as plt
import seaborn as sns
%matplotlib inline
plt.rc("font",family="SimHei",size="12")  #解决中文无法显示的问题
然后导入数据:
#导入数据
listings=pd.read_csv('F:\python\天池_短租数据分析\listings.csv')
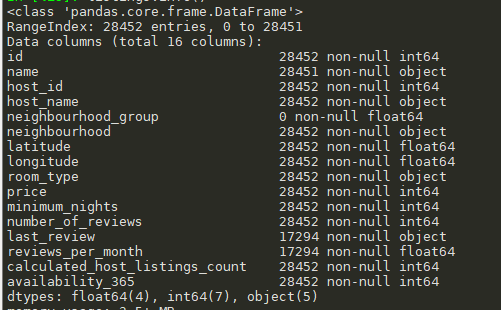
简单的数据查看
listings.info()
listings.head(5)
listings.shape
listings.describe()
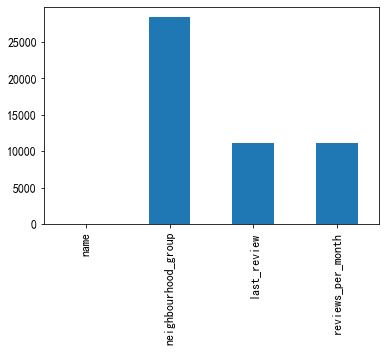
查看数据缺失情况:
#数据缺失计算
missing=listings.isnull().sum()
missing[missing>0].plot.bar()
区分数据特征个类别特征
#数据特征
numeric_features = listings.select_dtypes(include=[np.number])
numeric_features.columns
#类别特征
categorical_features = listings.select_dtypes(include=[np.object])
categorical_features.columns
查看类别特征的值的个数
for cat_fea in categorical_features:
    print(cat_fea + "的特征分布如下:")
    print("{}特征有个{}不同的值".format(cat_fea, listings[cat_fea].nunique()))
    print(listings[cat_fea].value_counts())
类别特征['name', 'host_name', 'neighbourhood', 'room_type', 'last_review']
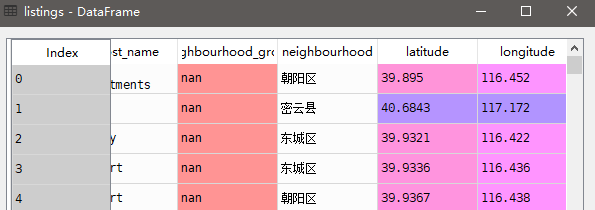
只保留neighbourhood,'/'前面的值
#使用str.split
listings['neighbourhood']=listings['neighbourhood'].str.split('/').str[0]
原来是这样:
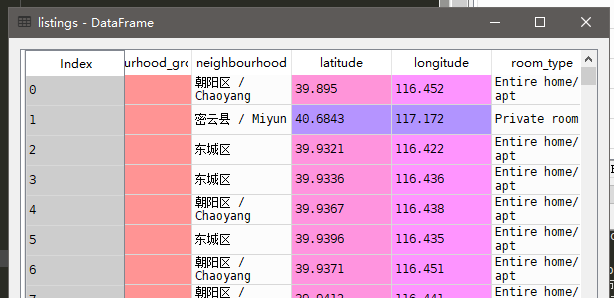
现在是这样:
由于neighbourhood_group的值全部一样,都是空值,因此将此删除
listings=listings.drop('neighbourhood_group',axis=1)
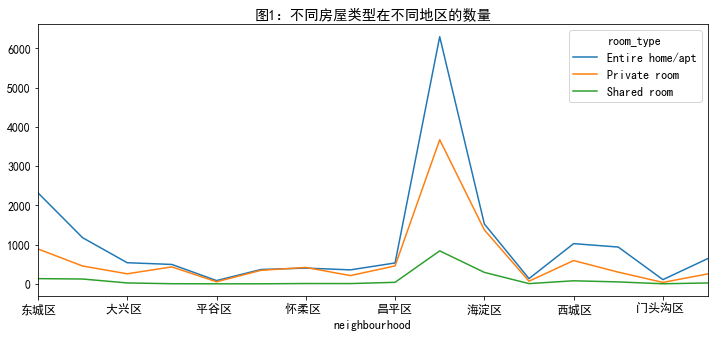
分析neighbourhood和room_type对和price的关系
#按照neighbourhood和room_type分组,计算每个值的个数和price的均值
neigh_roomtype=listings.groupby(['neighbourhood','room_type']).agg({'id':'size','price':'mean'})
#将ID改为number
neigh_roomtype=neigh_roomtype.rename(columns={'id':'number'})

#先对number计算统计可视化等
number_n_r=neigh_roomtype.unstack()['number']
number_n_r.plot(figsize=(12,5),title='图1:不同房屋类型在不同地区的数量')
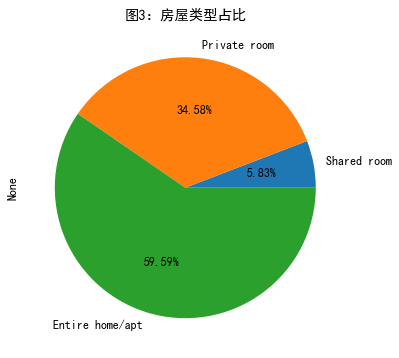
画饼图
#画饼图
number_n_r.sum(1).sort_values().plot.pie(figsize=(6,6),autopct='%.2f%%',title='图2:房屋地区占比')

#画饼图
number_n_r.sum(0).sort_values().plot.pie(figsize=(6,6),autopct='%.2f%%',title='图3:房屋类型占比')
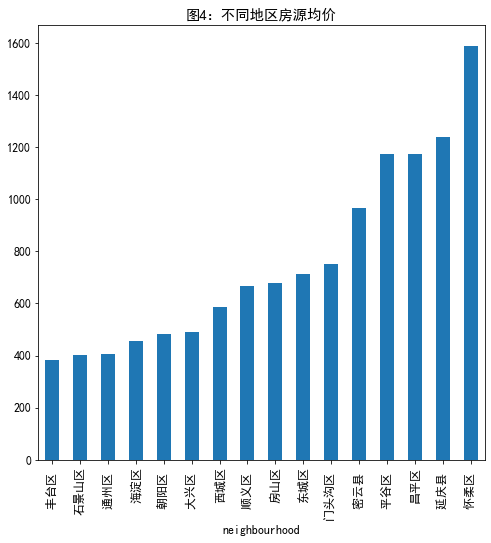
计算不同房源均价
#计不同地区均价
listings.groupby('neighbourhood')['price'].mean().sort_values().plot.bar(figsize=(8,8),title='图4:不同地区房源均价')
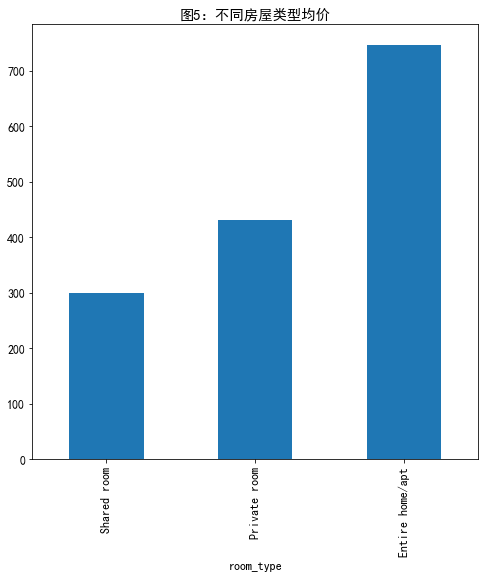
计算不同房屋类型均价
#不同房屋类型均价
listings.groupby('room_type')['price'].mean().sort_values().plot.bar(figsize=(8,8),title='图5:不同房屋类型均价')
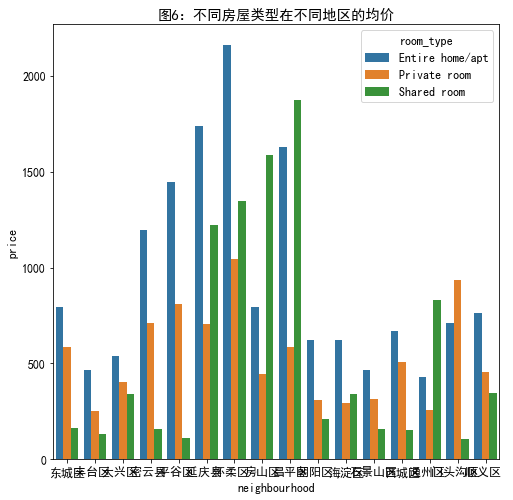
不同房源地区不同房屋类型均价
#不同房源地区和房子类型均价
n_r_data=listings.groupby(['neighbourhood','room_type'])['price'].mean()
plt.figure(figsize=(8,8))
plt.title('图6:不同房屋类型在不同地区的均价')
sns.barplot(x='neighbourhood',y='price',hue='room_type',data=n_r_data.reset_index())