Summary-functions-and-maps
教程
在上一教程中,我们学习了如何从DataFrame或Series中选择相关数据。 正如我们在练习中所展示的,从我们的数据表示中提取正确的数据对于完成工作至关重要。
但是,数据并非总是以我们想要的格式从内存中出来的。 有时,我们必须自己做一些工作以将其重新格式化以解决当前的任务。 本教程将介绍我们可以应用于数据以获取“恰到好处”输入的各种操作。
Pandas提供了许多简单的“摘要功能”(不是官方名称),它们以某种有用的方式重组了数据。 例如,考虑一下describe()方法:
reviews.points.describe()
Output:
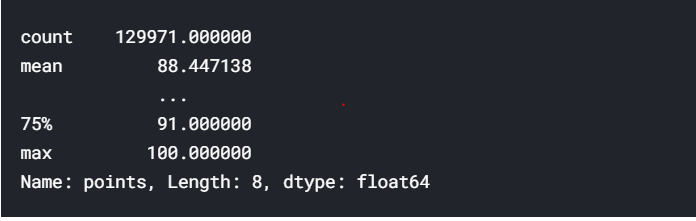
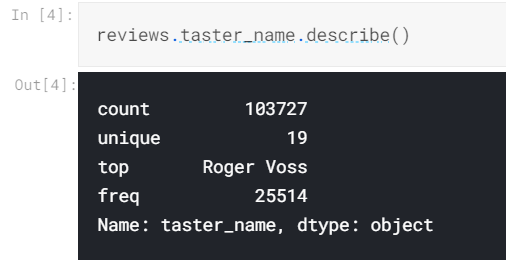
此方法生成给定列的属性的高级摘要。 它可识别类型,这意味着其输出根据输入的数据类型而变化。 上面的输出仅对数字数据有意义; 对于字符串数据,这是我们得到的:
如果要获取有关DataFrame或Series中某一列的某些特定的简单摘要统计信息,通常有一个有用的pandas函数可以实现此目的。
例如,要查看分配的分数的平均值(例如,平均评级的葡萄酒表现如何),我们可以使用mean()函数:
reviews.points.mean()
要查看唯一值的列表,我们可以使用unique()函数:
reviews.taster_name.unique()
要查看唯一值的列表以及它们在数据集中出现的频率,我们可以使用value_counts()方法:
reviews.taster_name.value_counts()
Maps
映射是一个从数学中借来的术语,表示一个函数,该函数采用一组值并将它们“映射”到另一组值。 在数据科学中,我们经常需要根据现有数据创建新的表示形式,或者将数据从现在的格式转换为我们希望其在以后使用的格式。 地图是处理这项工作的要素,这对完成工作极为重要!
您将经常使用两种映射方法。
map()是第一个,并且稍微简单一些。 例如,假设我们想将收到的葡萄酒的分数修正为0。我们可以这样做:
review_points_mean = reviews.points.mean()
reviews.points.map(lambda p: p - review_points_mean)
传递给map()的函数应该期望Series中的单个值(在上面的示例中为点值),并返回该值的转换版本。 map()返回一个新的Series,其中所有值都已由您的函数转换。
如果我们要通过在每一行上调用自定义方法来转换整个DataFrame,则apply()是等效的方法。
如:
def remean_points(row):
    row.points = row.points - review_points_mean
    return row

reviews.apply(remean_points, axis='columns')
如果我们使用axis ='index'调用了reviews.apply(),则需要传递一个函数来转换每一列,而不是传递函数来转换每一行。
请注意,map()和apply()分别返回新的,转换后的Series和DataFrames。 他们不会修改被调用的原始数据。 如果我们查看评论的第一行,我们可以看到它仍然具有其原始积分值。
练习
1.
What is the median of the points column in the reviews DataFrame?
median_points = reviews["points"].median()

# Check your answer
q1.check()
2.
What countries are represented in the dataset? (Your answer should not include any duplicates.)
countries = reviews["country"].unique()

# Check your answer
q2.check()
3.
How often does each country appear in the dataset? Create a Series reviews_per_country mapping countries to the count of reviews of wines from that country.
reviews_per_country = reviews["country"].value_counts ()
print(reviews_per_country)
# Check your answer
q3.check()
4.
Create variable centered_price containing a version of the price column with the mean price subtracted.
(Note: this 'centering' transformation is a common preprocessing step before applying various machine learning algorithms.)
mid=reviews["price"].mean()
centered_price = reviews["price"].map(lambda x: x-mid)

# Check your answer
q4.check()
5.
I'm an economical wine buyer. Which wine is the "best bargain"? Create a variable bargain_wine with the title of the wine with the highest points-to-price ratio in the dataset.
bargain_idx = (reviews.points / reviews.price).idxmax()
bargain_wine = reviews.loc[bargain_idx, 'title']
# Check your answer
q5.check()
6.
There are only so many words you can use when describing a bottle of wine. Is a wine more likely to be "tropical" or "fruity"? Create a Series descriptor_counts counting how many times each of these two words appears in the description column in the dataset.
n_trop = reviews.description.map(lambda desc: "tropical" in desc).sum()
n_fruity = reviews.description.map(lambda desc: "fruity" in desc).sum()
descriptor_counts = pd.Series([n_trop, n_fruity], index=['tropical', 'fruity'])
print(descriptor_counts)
# Check your answer
q6.check()
7.
We'd like to host these wine reviews on our website, but a rating system ranging from 80 to 100 points is too hard to understand - we'd like to translate them into simple star ratings. A score of 95 or higher counts as 3 stars, a score of at least 85 but less than 95 is 2 stars. Any other score is 1 star.
Also, the Canadian Vintners Association bought a lot of ads on the site, so any wines from Canada should automatically get 3 stars, regardless of points.
Create a series star_ratings with the number of stars corresponding to each review in the dataset.
def help(row):
    if(row["country"]=="Canada"):
        return 3
    if(row["points"]>=95):
        return 3
    elif(row["points"]>=85):
        return 2
    else:
        return 1


star_ratings =  reviews.apply(help,axis='columns')

print(star_ratings)


# Check your answer
q7.check()