本文的目的是记录meshgrid()的理解过程:
step1. 通过一个示例引入创建网格点矩阵;
step2. 基于步骤1,说明meshgrid()的作用;
step3. 详细解读meshgrid()的官网定义;
说明:step1和2 的数据都是基于笛卡尔坐标系的矩阵,目的是为了方便讨论。
step1. 通过一个示例引入创建网格点矩阵;
示例1,创建一个2行3列的网格点矩阵。
 1 #!/usr/bin/env python3
 2 #-*- coding:utf-8 -*-
 3 ############################
 4 #File Name: meshgrid1.py
 5 #Brief:
 6 #Author: frank
 7 #Mail: frank0903@aliyun.com
 8 #Created Time:2018-06-14 21:33:14
 9 ############################
10 import numpy as np
11 import matplotlib.pyplot as plt
12
13 X = np.array([[0, 0.5, 1],[0, 0.5, 1]])
14 print("X的维度:{},shape:{}".format(X.ndim, X.shape))
15 Y = np.array([[0, 0, 0],[1, 1, 1]])
16 print("Y的维度:{},shape:{}".format(Y.ndim, Y.shape))
17
18 plt.plot(X, Y, 'o--')
19 plt.grid(True)
20 plt.show()
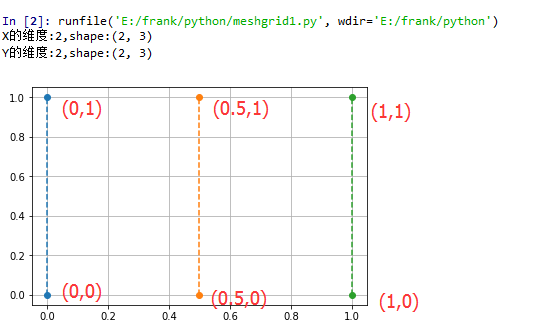
X矩阵是:[[0. 0.5 1. ], [0. 0.5 1. ]]
Y矩阵是:[[0 0 0],[1 1 1]]
step2. meshgrid()的作用;
当要描绘的 矩阵网格点的数据量小的时候,可以用上述方法构造网格点坐标数据;
但是如果是一个(256, 100)的整数矩阵网格,要怎样构造数据呢?
方法1:将x轴上的100个整数点组成的行向量,重复256次,构成shape(256,100)的X矩阵;将y轴上的256个整数点组成列向量,重复100次构成shape(256,100)的Y矩阵
显然方法1的数据构造过程很繁琐,也不方便调用,那么有没有更好的办法呢?of course!!!
那么meshgrid()就显示出它的作用了
使用meshgrid方法,你只需要构造一个表示x轴上的坐标的向量和一个表示y轴上的坐标的向量;然后作为参数给到meshgrid(),该函数就会返回相应维度的两个矩阵;
例如,你想构造一个2行3列的矩阵网格点,那么x生成一个shape(3,)的向量,y生成一个shape(2,)的向量,将x,y传入meshgrid(),最后返回的X,Y矩阵的shape(2,3)
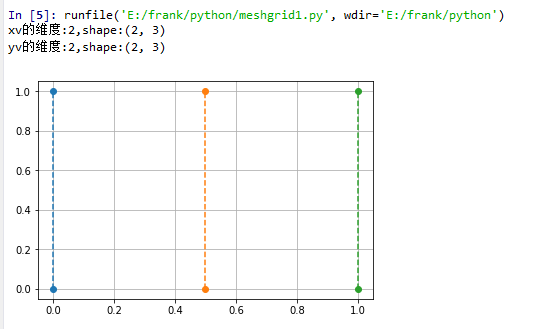
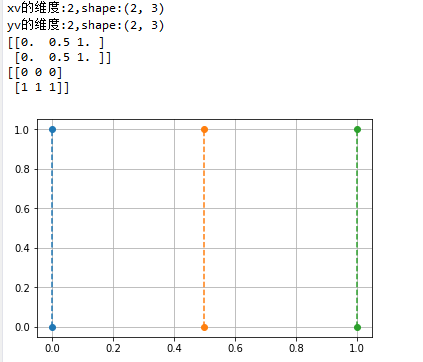
示例2,使用meshgrid()生成step1中的网格点矩阵
 1 x = np.array([0, 0.5, 1])
 2 y = np.array([0,1])
 3
 4 xv,yv = np.meshgrid(x, y)
 5 print("xv的维度:{},shape:{}".format(xv.ndim, xv.shape))
 6 print("yv的维度:{},shape:{}".format(yv.ndim, yv.shape))
 7
 8 plt.plot(xv, yv, 'o--')
 9 plt.grid(True)
10 plt.show()
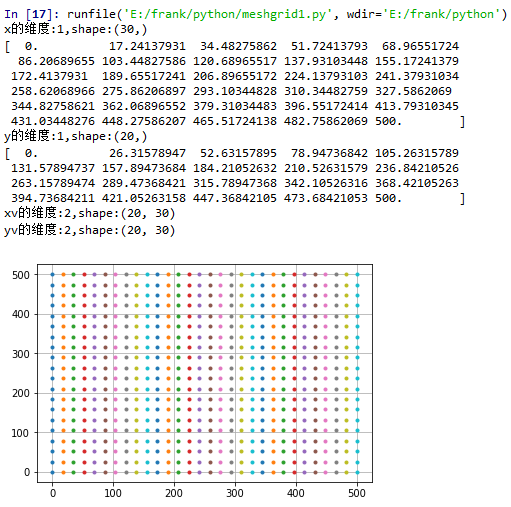
示例3,生成一个20行30列的网格点矩阵
 1 x = np.linspace(0,500,30)
 2 print("x的维度:{},shape:{}".format(x.ndim, x.shape))
 3 print(x)
 4 y = np.linspace(0,500,20)
 5 print("y的维度:{},shape:{}".format(y.ndim, y.shape))
 6 print(y)
 7
 8 xv,yv = np.meshgrid(x, y)
 9 print("xv的维度:{},shape:{}".format(xv.ndim, xv.shape))
10 print("yv的维度:{},shape:{}".format(yv.ndim, yv.shape))
11
12 plt.plot(xv, yv, '.')
13 plt.grid(True)
14 plt.show()
step3. 详细解读meshgrid()的官网定义;
numpy.meshgrid(*xi, **kwargs)
Return coordinate matrices from coordinate vectors.
根据输入的坐标向量生成对应的坐标矩阵
Parameters:
x1, x2,…, xn : array_like
1-D arrays representing the coordinates of a grid.
indexing : {‘xy’, ‘ij’}, optional
Cartesian (‘xy’, default) or matrix (‘ij’) indexing of output. See Notes for more details.
sparse : bool, optional
If True a sparse grid is returned in order to conserve memory. Default is False.
copy : bool, optional
If False, a view into the original arrays are returned in order to conserve memory.
Default is True. Please note that sparse=False, copy=False will likely return non-contiguous arrays.
Furthermore, more than one element of a broadcast array may refer to a single memory location.
If you need to write to the arrays, make copies first.
Returns:
X1, X2,…, XN : ndarray
For vectors x1, x2,…, ‘xn’ with lengths Ni=len(xi) ,
return (N1, N2, N3,...Nn) shaped arrays if indexing=’ij’
or (N2, N1, N3,...Nn) shaped arrays if indexing=’xy’
with the elements of xi repeated to fill the matrix along the first dimension for x1, the second for x2 and so on.
针对indexing参数的说明:
indexing只是影响meshgrid()函数返回的矩阵的表示形式,但并不影响坐标点
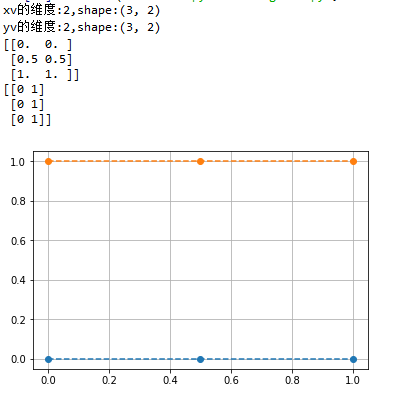
 1 x = np.array([0, 0.5, 1])
 2 y = np.array([0,1])
 3
 4 xv,yv = np.meshgrid(x, y)
 5 print("xv的维度:{},shape:{}".format(xv.ndim, xv.shape))
 6 print("yv的维度:{},shape:{}".format(yv.ndim, yv.shape))
 7 print(xv)
 8 print(yv)
 9
10 plt.plot(xv, yv, 'o--')
11 plt.grid(True)
12 plt.show()
 1 x = np.array([0, 0.5, 1])
 2 y = np.array([0,1])
 3
 4 xv,yv = np.meshgrid(x, y,indexing='ij')
 5 print("xv的维度:{},shape:{}".format(xv.ndim, xv.shape))
 6 print("yv的维度:{},shape:{}".format(yv.ndim, yv.shape))
 7 print(xv)
 8 print(yv)
 9
10 plt.plot(xv, yv, 'o--')
11 plt.grid(True)
12 plt.show()