https://www.cnblogs.com/xing901022/p/6030296.html
ELK简介:
Elasticsearch是个开源分布式搜索引擎,它的特点有:分布式,零配置,自动发现,索引自动分片,索引副本机制,restful风格接口,多数据源,自动搜索负载等,
ELK官网:https://www.elastic.co/
Logstash是一个完全开源的工具,他可以对你的日志进行收集、过滤,并将其存储供以后使用(如,搜索)。
Kibana 也是一个开源和免费的工具,它Kibana可以为 Logstash 和 ElasticSearch 提供的日志分析友好的 Web 界面,可以帮助您汇总、分析和搜索重要数据日志。
Logstash和Elasticsearch是用Java语言编写,而Kibana使用node.js框架,在配置ELK环境要保证系统有JAVA JDK开发库哦。
1)Elasticsearch是一个基于Lucene的开元分布式搜索服务器,特点为分布式,零配置,自动发现,索引自动分片,索引副本机制,restful风格接口,多数据源,自动搜索负载等,提供了分布式多用户能力全问搜索服务器,基于RESTful web接口,所有节点的数据是均等的
2)Logstash是一个完全开源的工具,可以对日志进行收集,过滤,分析,并将其存储Elasticsearch里提供使用,
3)Kibana是一个基于浏览器页面的elasticsearch前端展示工具,也是一个开源和免费的工具,kibana可以为logstash和elasticsearch提供日志分析的web展示平台,可以帮助汇总,分析和搜索重要的数据日志
ELK原理拓扑图
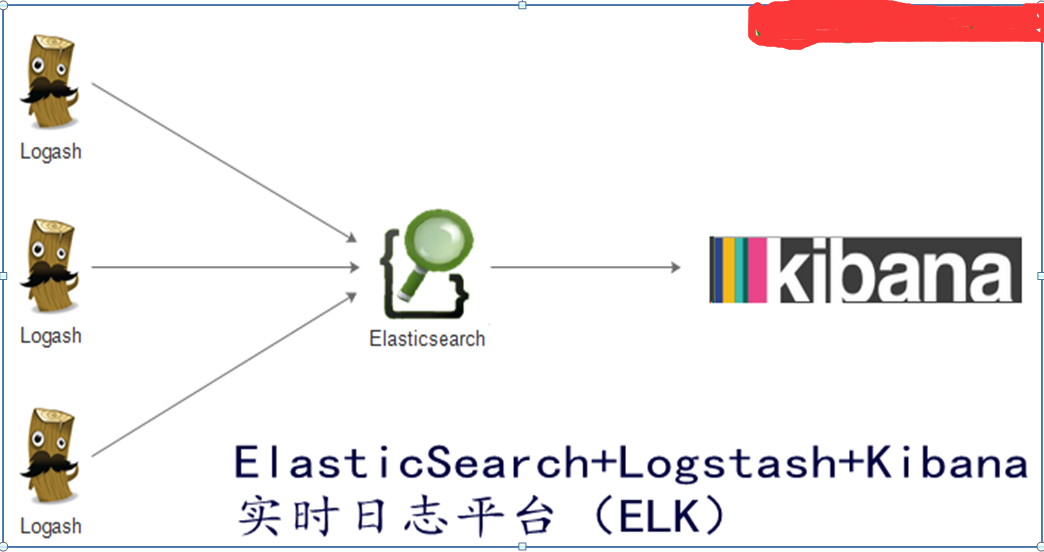
Elk工作流程
1)通过logstash收集客户端App的日志数据,将所有的日志过滤 出来,并存入Elasticsearch搜索引擎,然后通过Kibana GUI在web前端展示给用户,最后用户可可以进行查看制定的日志内容
2)如果加入Redis通信流程如一下图所示:

ELK+Redis工作流程(样板一)
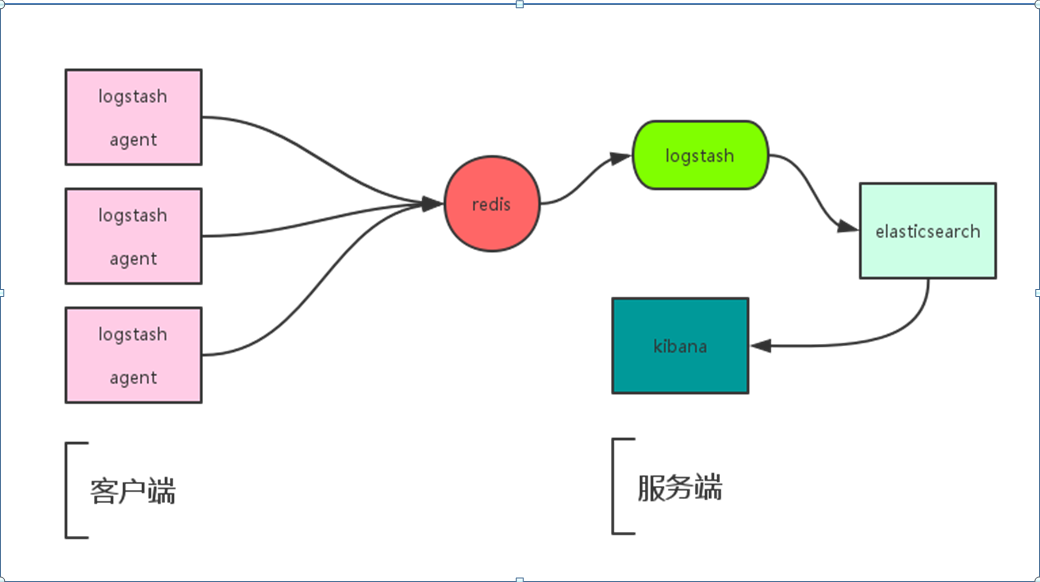
ELK+Redis工作流程(样板二)
Redis+ELK工作流程
Logstash包含index和Agent(shipper),agent负责收集客户端日志监控和过滤 ,而index负责收集日志并提交给Elasticsearch,ES将index收集来的日志存储到本地,并建立搜素引擎,提供搜素,最后由Kibana从ES中获取自己想要的日志数据信息;
[root@elasticsearch ~]# tar zxvf jdk1.8.0_131.tar.gz
[root@elasticsearch ~]# mv jdk1.8.0_131 /usr/
export JAVA_HOME=/usr/jdk1.8.0_131/
export CLASSPATH=$CLASSPATH:$JAVA_HOME/lib:$JAVA_HOME/jre/lib
export PATH=$JAVA_HOME/bin:$JAVA_HOME/jre/bin:$PATH:$HOMR/bin
[root@elasticsearch ~]# source /etc/profile
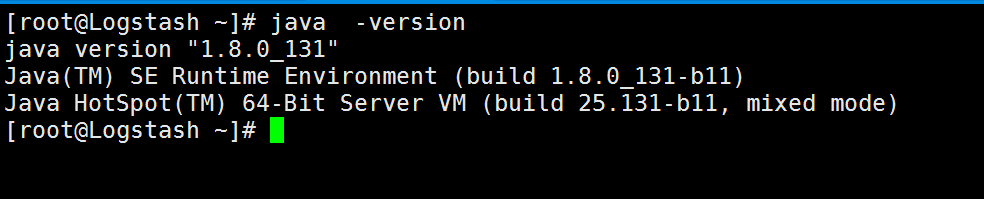
[root@elasticsearch ~]# java -version
java version "1.8.0_131"
Java(TM) SE Runtime Environment (build 1.8.0_131-b11)
Java HotSpot(TM) 64-Bit Server VM (build 25.131-b11, mixed mode)
[root@elasticsearch ~]# wget https://artifacts.elastic.co/downloads/elasticsearch/elasticsearch-5.3.0.tar.gz
[root@elasticsearch ~]# tar zxvf elasticsearch-5.3.0.tar.gz
[root@elasticsearch ~]# mv elasticsearch-5.3.0 /usr/local/elasticsearch
[root@elasticsearch ~]# vim /usr/local/elasticsearch/config/elasticsearch.yml

[root@elasticsearch ~]# useradd elk
[root@elasticsearch ~]# chown -R elk:elk /usr/local/elasticsearch/
[root@elasticsearch ~]# su - elk
[elk@elasticsearch elasticsearch]$ /usr/local/elasticsearch/bin/elasticsearch -d #启动elasticsearch,随后tail查看日志信息,发现未能正常启动,出现一下报错

【解决方法如下】
[root@elasticsearch ~]# vim /etc/security/limits.conf #设置守护进程的文件数量限制
* soft nofile 65536
* hard nofile 65536
PS【参数详解信息如下】
type:
有 soft,hard 和 -,
soft 指的是当前系统生效的设置值。
hard 表明系统中所能设定的最大值。
soft 的限制不能比har 限制高。用 - 就表明同时设置了 soft 和 hard 的值。
resource:
core - 限制内核文件的大小
date - 最大数据大小
fsize - 最大文件大小
memlock - 最大锁定内存地址空间
nofile - 打开文件的最大数目
rss - 最大持久设置大小
stack - 最大栈大小

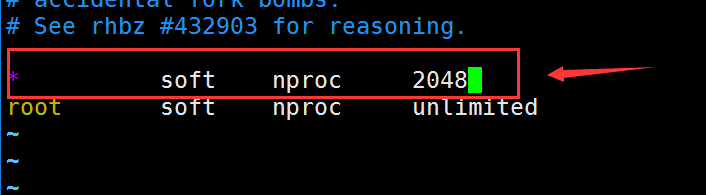
[root@elasticsearch ~]# vim /etc/security/limits.d/20-nproc.conf
[root@elasticsearch ~]# vim /etc/sysctl.conf #修改内核参数
vm.max_map_count=655360
[root@elasticsearch ~]# sysctl -p (reboot重启)
root@elasticsearch ~]# su - elk
上一次登录:三 10月 25 12:14:36 CST 2017pts/1 上
[elk@elasticsearch ~]$ /usr/local/elasticsearch/bin/elasticsearch -d #切换到新建 普通用户启动ES
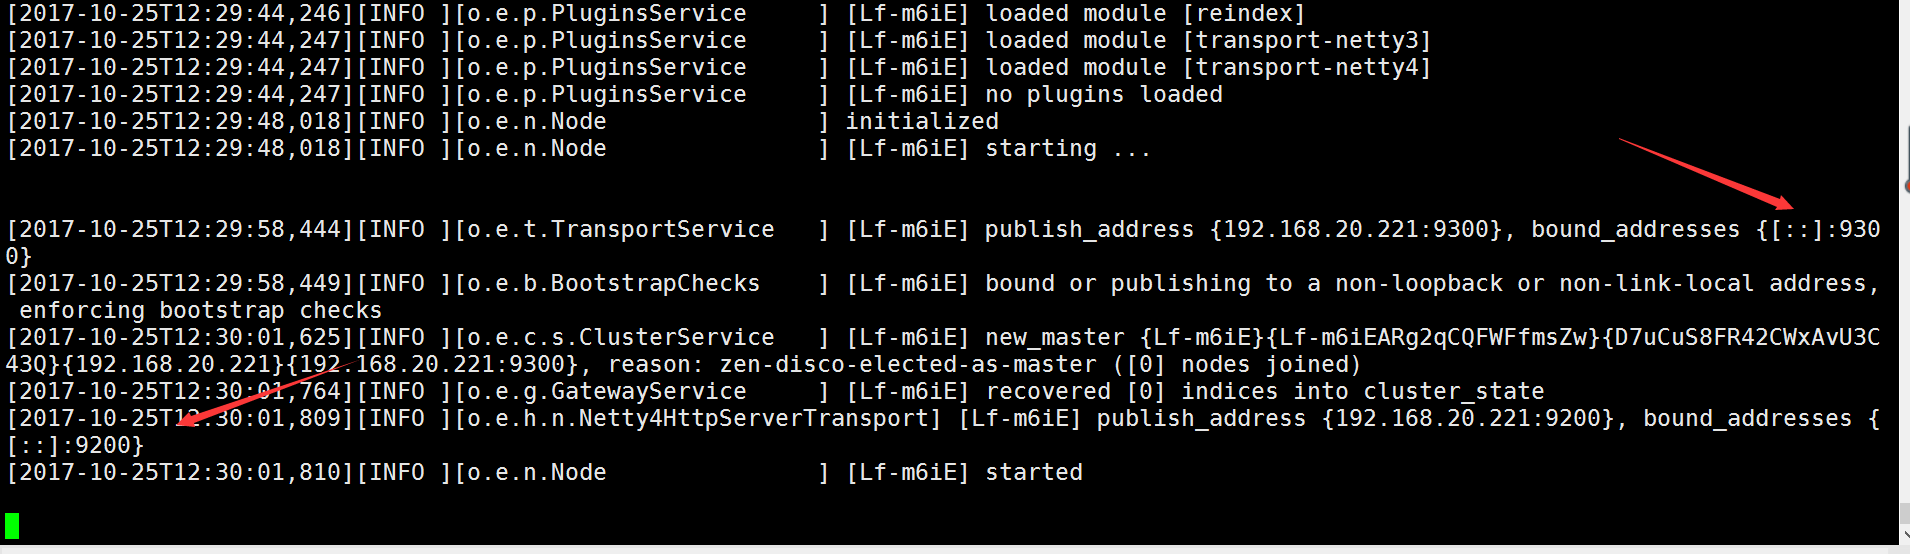
[elk@elasticsearch ~]$ netstat -anput | grep -E "9200|9300"

【安装Elasticsearch-head插件】
[root@elasticsearch ~]#git clone git://github.com/mobz/elasticsearch-head.git
【下载nodejs】
[root@elasticsearch ~]#https://nodejs.org/en/download/
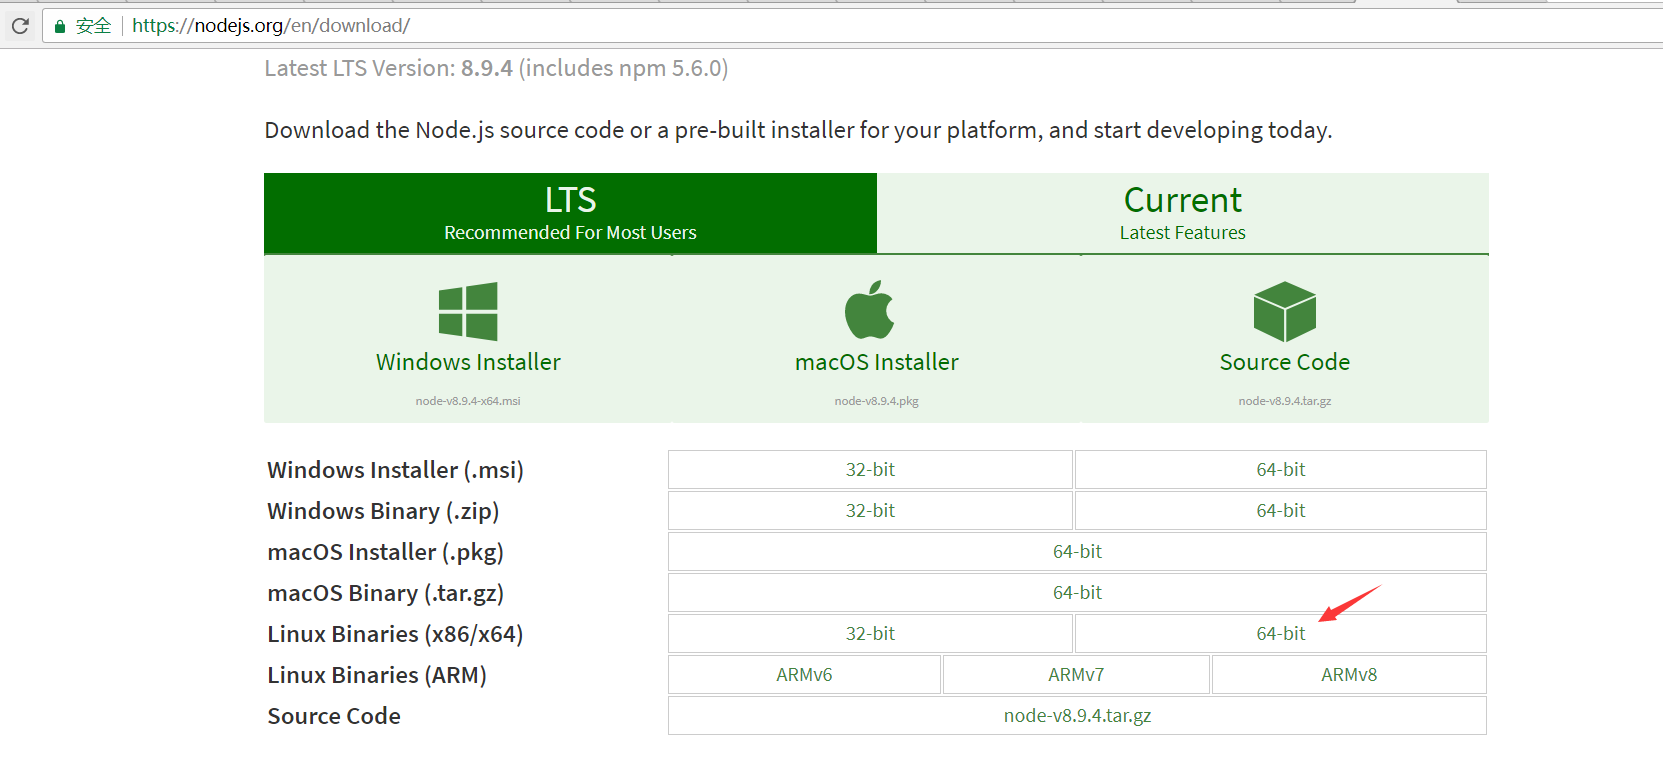
[root@elasticsearch ~]# wget https://nodejs.org/dist/v8.9.4/node-v8.9.4-linux-x64.tar.xz
[root@elasticsearch ~]# xz node-v8.9.4-linux-x64.tar.xz
[root@elasticsearch ~]# tar xvf node-v8.9.4-linux-x64.tar.xz
[root@elasticsearch ~]# set node environment
解压完node的安装文件后,需要配置下环境变量,编辑/etc/profile,添加
[root@elasticsearch ~]# vim /etc/profile
export NODE_HOME=/root/node-v8.9.4-linux-x64
export PATH=$PATH:$NODE_HOME/bin
[root@elasticsearch ~]# source /etc/profile
root@elasticsearch ~]# echo $NODE_HOME
/root/node-v8.9.4-linux-x64
[root@elasticsearch ~]# node -v
v8.9.4
[root@elasticsearch ~]# npm -v
5.6.0
【安装grunt】
把grunt的命令行工具安装到全局
[root@elasticsearch elasticsearch-head]# npm install -g grunt-cli
/root/node-v8.9.4-linux-x64/bin/grunt -> /root/node-v8.9.4-linux-x64/lib/node_modules/grunt-cli/bin/grunt
+ grunt-cli@1.2.0
added 16 packages in 2.579s
[root@elasticsearch elasticsearch-head]# vim /usr/local/elasticsearch/config/elasticsearch.yml
http.cors.enabled: true
http.cors.allow-origin: "*"
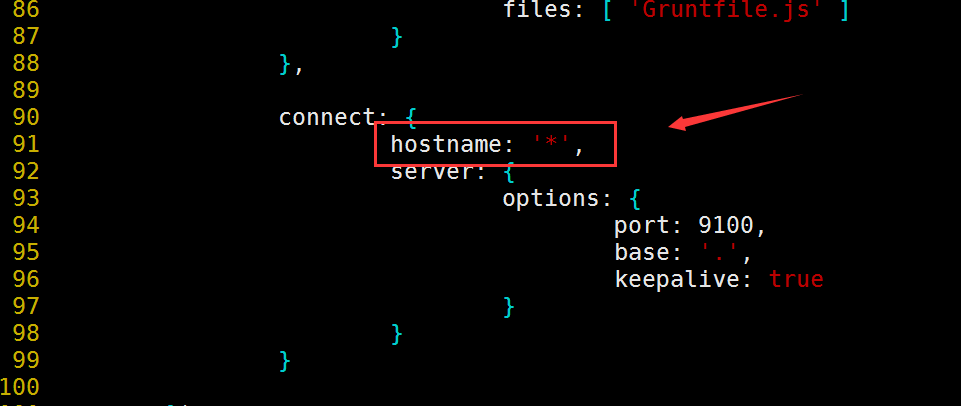
【修改head源码】
[root@elasticsearch ~]# vim elasticsearch-head/Gruntfile.js #修改服务器监听地址
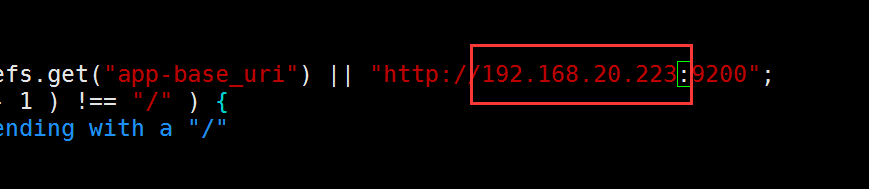
编辑head/_site/app.js,修改head连接es的地址;
将localhost修改为es的IP地址。
[root@elasticsearch ~]# vim elasticsearch-head/_site/app.js
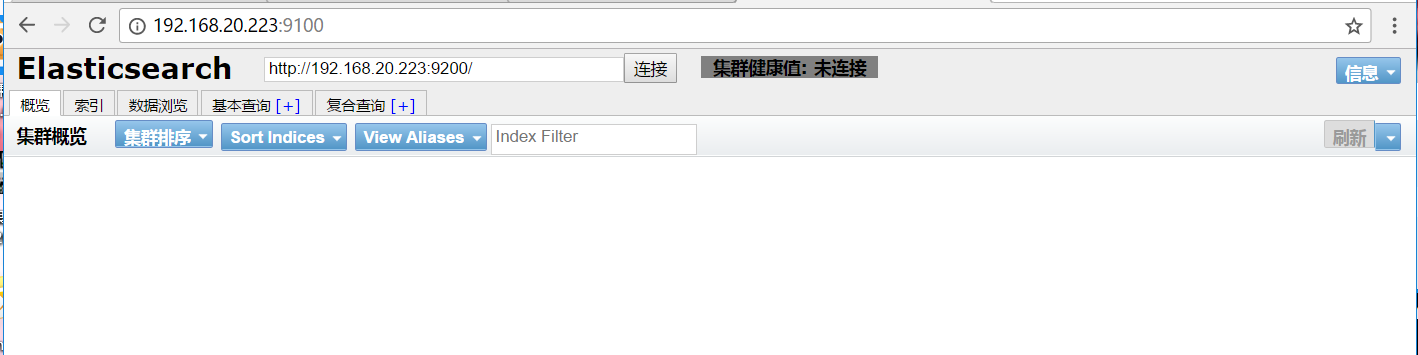
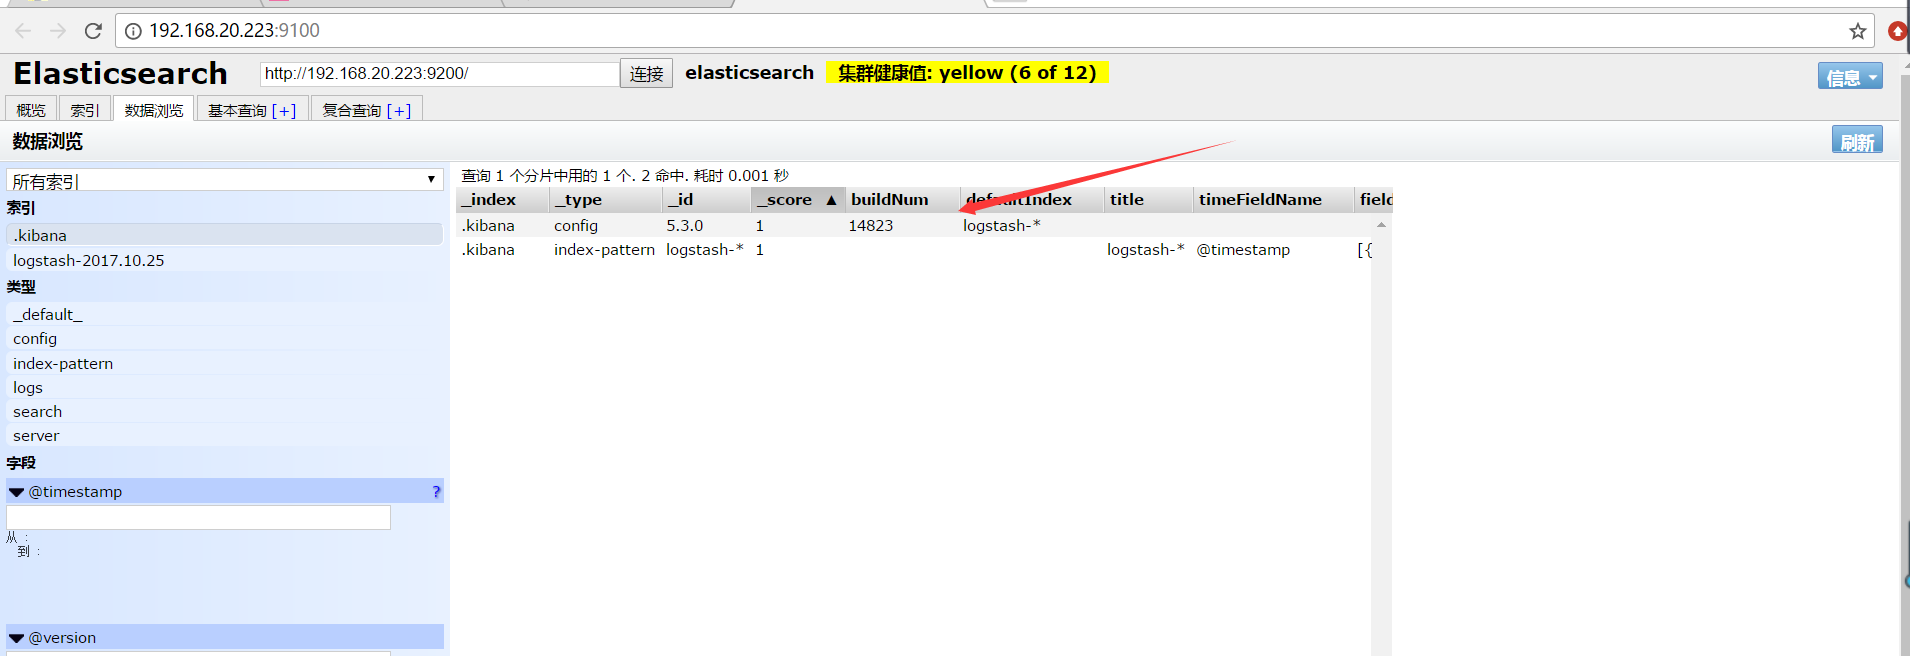
[root@elasticsearch elasticsearch-head]# nohup grunt server &
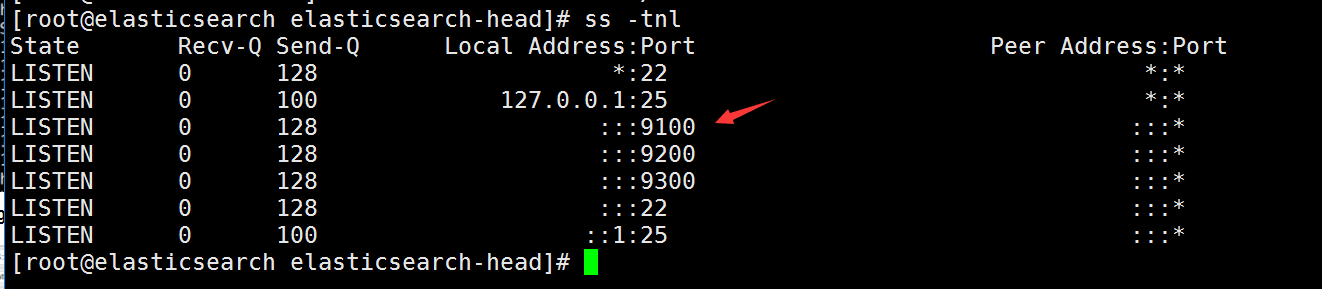
浏览器访问:http://192.168.20.223:9100/即可【目前ES里面没有默认是没有任何数据,也没有和Kibana以及Logstash整合】
【Kibana部署&配置】
[root@kibana ~]# wget https://artifacts.elastic.co/downloads/kibana/kibana-5.3.0-linux-x86_64.tar.gz
root@kibana ~]# tar zxvf kibana-5.3.0-linux-x86_64.tar.gz
[root@kibana ~]# mv kibana-5.3.0-linux-x86_64 /usr/local/kibana
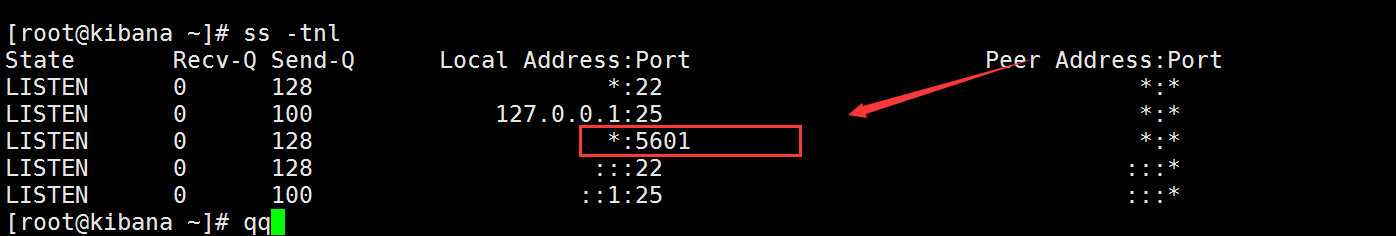
[root@kibana ~]# vim /usr/local/kibana/config/kibana.yml

[root@kibana ~]# nohup /usr/local/kibana/bin/kibana &
【安装Logstash】
[root@Logstash ~]# tar zxvf jdk1.8.0_131.tar.gz
[root@Logstash ~]# mv jdk1.8.0_131 /usr/
[root@Logstash ~]# vim /etc/profile
export JAVA_HOME=/usr/jdk1.8.0_131/
export CLASSPATH=$CLASSPATH:$JAVA_HOME/lib:$JAVA_HOME/jre/lib
export PATH=$JAVA_HOME/bin:$JAVA_HOME/jre/bin:$PATH:$HOMR/bin
[root@Logstash ~]# wget https://artifacts.elastic.co/downloads/logstash/logstash-5.3.0.tar.gz
[root@Logstash ~]# tar zxvf logstash-5.3.0.tar.gz
[root@Logstash ~]# mv logstash-5.3.0 /usr/local/logstash
[root@Logstash ~]# mkdir /usr/local/logstash/config/etc
[root@Logstash ~]# cd /usr/local/logstash/config/etc/
[root@Logstash etc]# vim logstash.conf
input { #标准输入
stdin { }
}
output { #标准输出
stdout {
codec =>rubydebug {}
}
elasticsearch {
hosts => "192.168.20.2223" } #指定Elasticsearch的ip地址信息
}
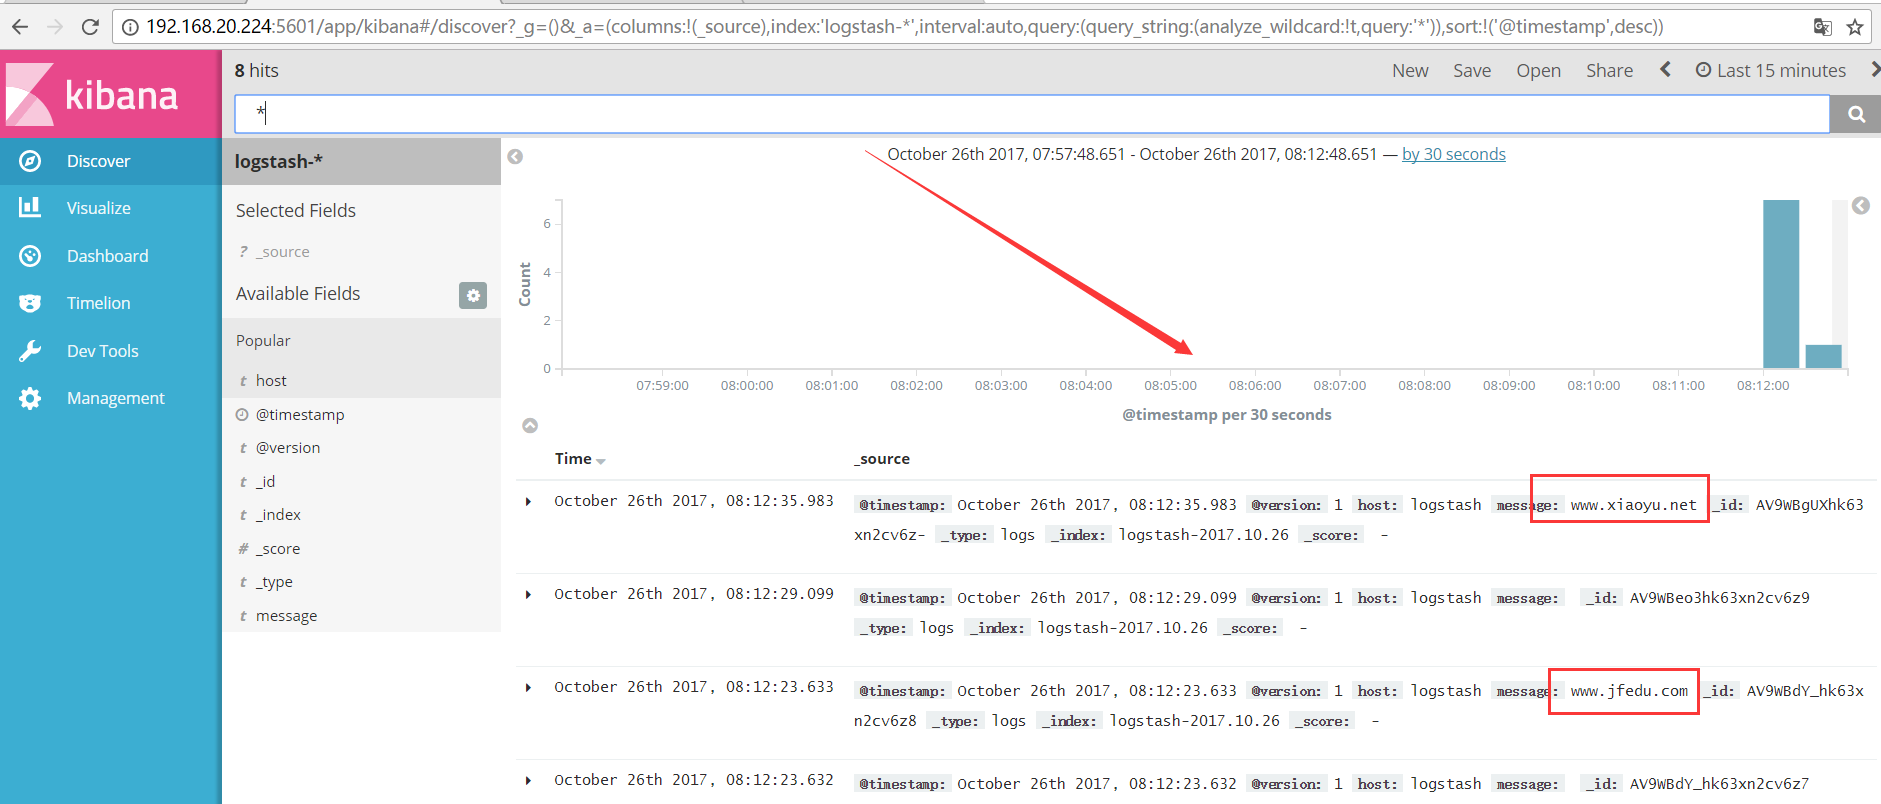
[root@logstash etc]# /usr/local/logstash/bin/logstash -f logstash.conf #手动输出日志个格式,随后查看Kibana能够收集到


为了使用Kibana,必须要配置至少一个索引,索引模式是为了确认Elasticsearch Iindex,用来运行搜索和分析,也可以用来配置字段
Index contains time-based events 索引基于时间的事件
Use event times to create index names [DEPRECATED] 使用事件时间来创建索引名字【过时】
Index name or pattern 索引名字或者模式
模式允许你定义动态的索引名字 使用*作为通配符,例如默认:
logstash-*
选择:

搭建完成之后,我们可以将ELK与redis整合,从而实现高效,一下连接便是ELK+redis+Nginx日志收集的配置步骤!
http://www.cnblogs.com/bixiaoyu/p/7739785.html