Simone Chiaretta (http://codeclimber.net.nz/archive/2016/05/20/How-to-debug-NET-Core-RC2-app-with-Visual-Studio.aspx)
So, you installed .NET Core RC2 , you followed the getting started tutorial and you got your “Hello World!” printed on your command prompt just by using the CLI. Then you went the next step and you tried to use Visual Studio Code and the C# extension to edit the application outside of Visual Studio. And finally you want to try and debug and set a breakpoint inside the application, but you encountered some problems and nothing worked. Here is how to make it work.
Specify the launch configuration
Visual Studio Code needs to know how to launch your application, and this is specified in alaunch.json file inside the .vscode folder. From the debug window, click the “gear” icon and Code will create it for you: just choose the right environment “.NET Core”.
Then you must specify the path to your executable in the program property. In the standard hwapp sample app, replace
1: "program": "${workspaceRoot}/bin/Debug/<target-framework>/<project-name.dll>",
with
1: "program": "${workspaceRoot}/bin/Debug/netcoreapp1.0/hwapp.dll",
There is much more you can specify in the launch.json file. To see all the options have a look at the official doc: Debugging in Visual Studio Code.
Specify the task runner
If you try to debug now you’ll have another warning: “No task runner configured”.This is because for launching, VS Code has to build the project, and this is done via a task. But no worries, just click the “Configure Task Runner” button in the info box, choose which task runner you want to use, in this case “.NET Core”, and the tasks.json file will be created for you. More info on task runners in VS Code can be found on the offical documentation: Tasks in Visual Studio Code.
Running and debugging
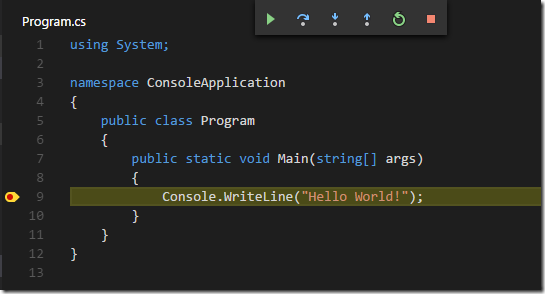
Now you can click the “Start Debugging” button or F5 and the application runs. Cool… Now you set a breakpoint and the executions stops where you set it, doesn’t it? Well… if you are on Mac or Linux it does. But it doesn’t stop if you are on Windows and the Debug Console says something like:
1: WARNING: Could not load symbols for 'hwapp.dll'.
   2: '...hwappinDebug
etcoreapp1.0hwapp.pdb' is a Windows PDB.
3: These are not supported by the cross-platform .NET Core debugger.
Introducing Portable PDBs
In order to be able to debug cross-platform, .NET Core has now a “portable PDB” format, and the newly introduced .NET Core debugger for Visual Studio Code only supports this format. Unfortunately by default, on Windows, the .NET Core build generates standard “Windows PDBs”, which are not supported. But the fix is easy, you just have to tell the compiler to generate portable PDBs.
This is done by specifying the debugType to be portable.
1: {2: "buildOptions": {
3: "debugType": "portable"
4: }, 5: ... 6: }And voila! Breakpoints are hit!
