-
环境
PHPSTUDY8
PHP 7.3
xdebug 使用phpstudy 自带
PHPSTORM 2019.1
-
配置php.ini
[Xdebug]
;启用性能检测分析
;启用代码自动跟踪
xdebug.profiler_enable_trigger = On
xdebug.profiler_output_name = cachegrind.out.%t.%p
;指定性能分析文件的存放目录
xdebug.show_local_vars=0
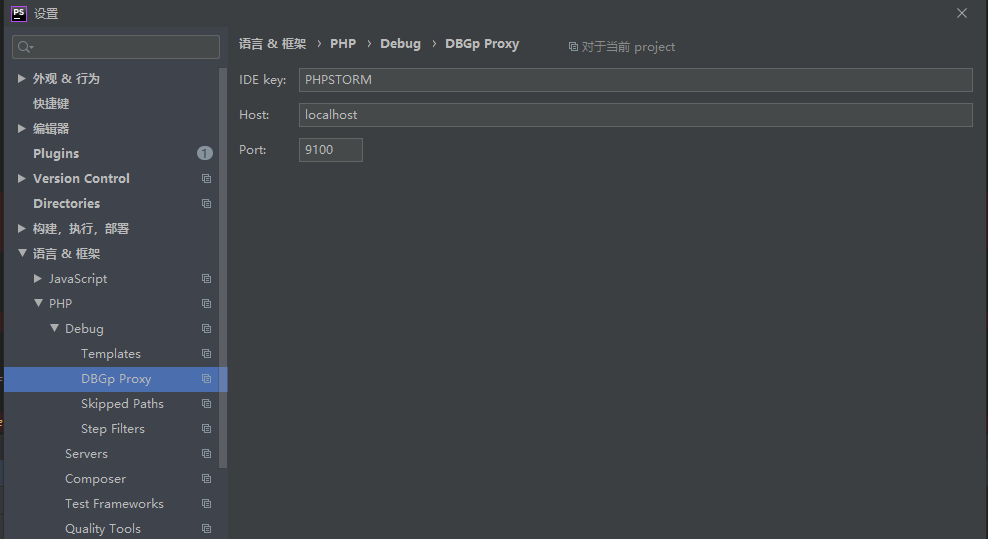
xdebug.idkey="PHPSTORM"
;配置端口和监听的域名
zend_extension=D:/phpstudy_pro/Extensions/php/php7.3.4nts/ext/php_xdebug.dll
xdebug.collect_params=1
xdebug.collect_return=1
xdebug.auto_trace=Off
xdebug.trace_output_dir=D:/phpstudy_pro/Extensions/php_log/php7.3.4nts.xdebug.trace
xdebug.profiler_enable=Off
xdebug.profiler_output_dir=D:/phpstudy_pro/Extensions/php_log/php7.3.4nts.xdebug.profiler
xdebug.remote_enable=1
xdebug.remote_host=localhost
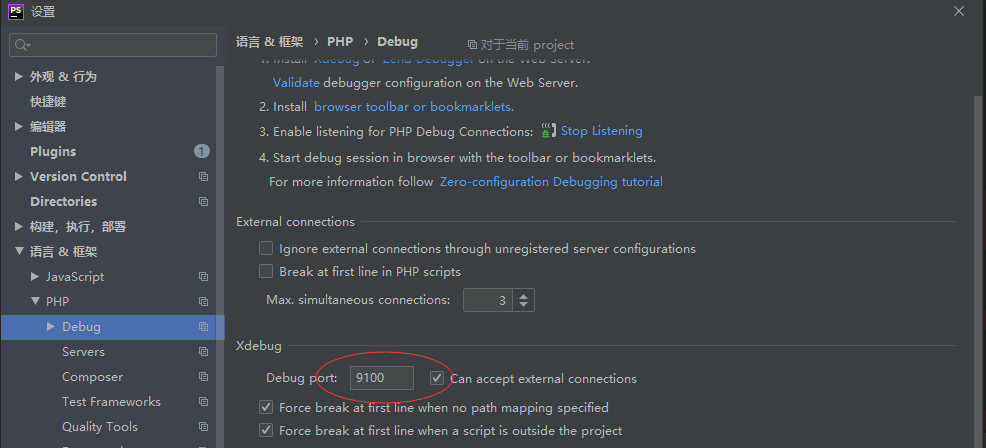
xdebug.remote_port=9100
xdebug.remote_handler=dbgp
-
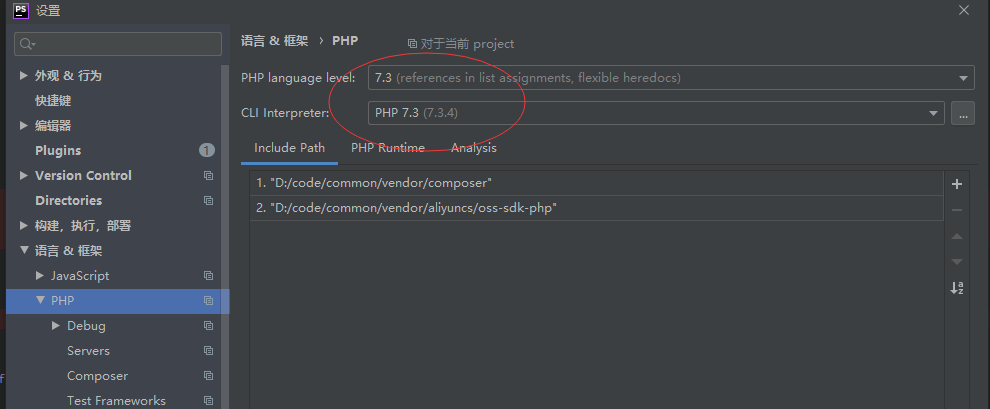
配置phpstorm
php设置 选择自己的php版本
debug配置
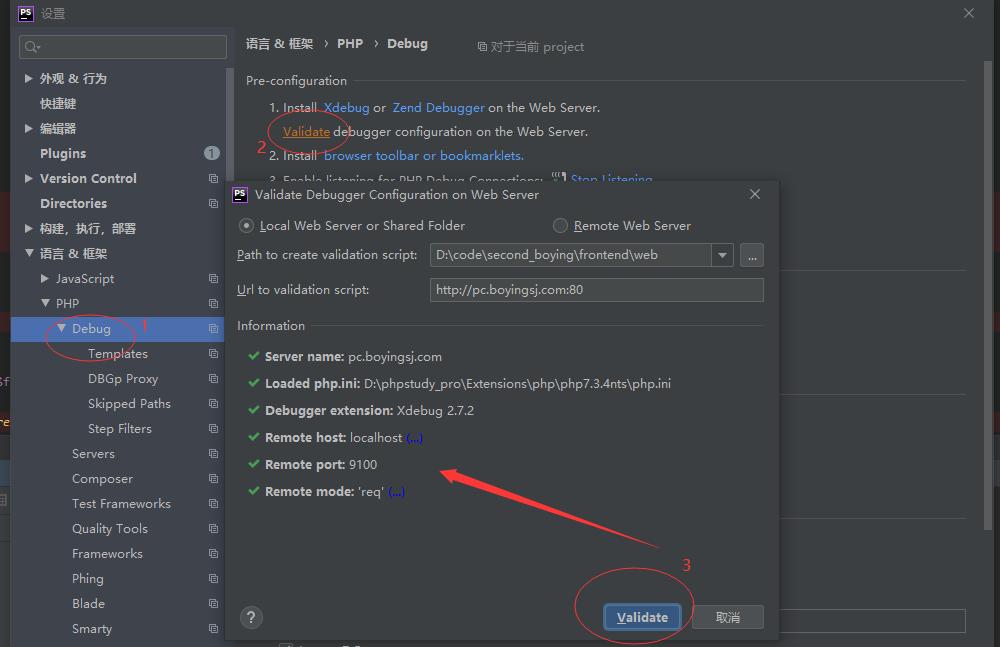
debug validate检查
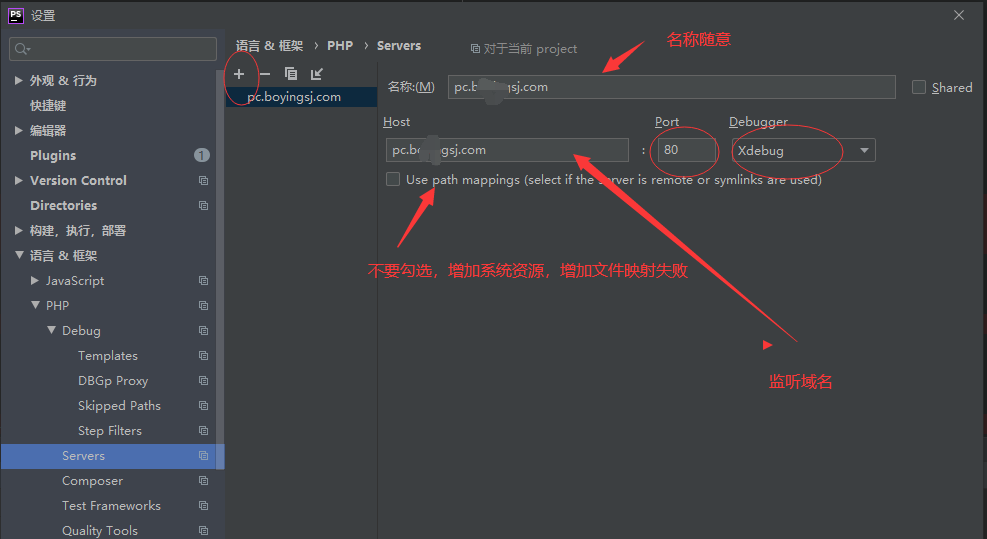
servers设置
菜单栏 file->setting->php->servers(找不到可以搜索server就出来了)
-
安装浏览器插件
https://www.jetbrains.com/help/phpstorm/2019.3/browser-debugging-extensions.html?utm_source=product&utm_medium=link&utm_campaign=PS&utm_content=2019.3

-
最后打开PHPSTORM 右上角 监听设置
-
备注:
开启phpsrotm调试,提示:
Can't start listening for connections from 'xdebug': Port 9000 is busy
说明端口被占用,换其他端口