注释功能
如果大家用过echarts2.0的画辅助线功能,可以选择highcharts的这个注释功能可以画线,而且还可以添加文字等,功能更强大了。因为echarts3.0没有画线辅助线功能,逼着本人使用highcharts,用了一段时间以后觉得highchart还很好使。
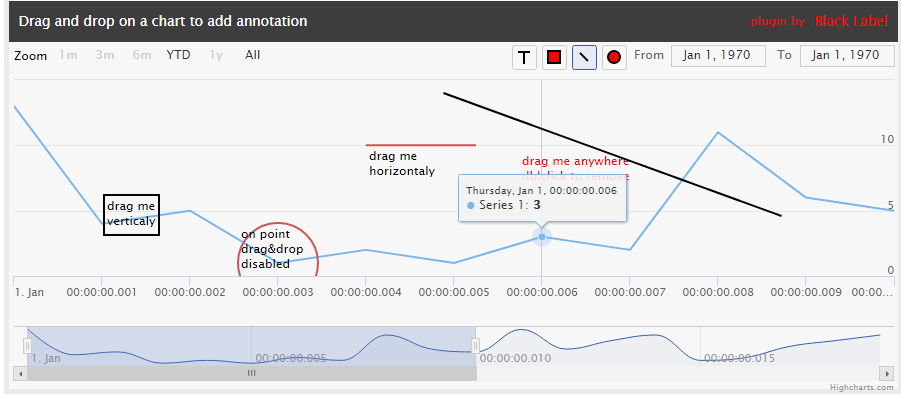
先给大家看下效果图。
安装
像任何其他的Highcharts模块(例如导出)一样,添加<script>标签指向annotations.js 下边是Highcharts的脚本标签。
<script src="./annotations-master/js/annotations.js"></script>
对于NPM用户:
var Highcharts = require('highcharts'),
    HighchartsAnnotations = require('annotations')(Highcharts);
示例代码
new Highcharts.Chart({
  chart: {
    renderTo: container
  },
  series: [{
      data: [29.9, 71.5, 106.4, 129.2, 144.0, 176.0]
  }],
  annotations: [{
    xValue: 4,
    yValue: 125,
    title: {
        text: "Annotated chart!"
    },
    events: {
        click: function(e) { console.log("Annotation clicked:", this); }
    }
  }]
})
可用选项
图表选项
| 选项 | 描述 |
| chart.annotations | 包含注释配置对象的数组 |
| chart.annotationsOptions | 注释的默认选项(如按钮列表) |
注释配置对象
| 选项 | 描述 |
|---|---|
| x y |
以像素定义的注释位置 |
| xValue yValue |
使用轴值定义的注释位置 |
| xValueEnd yValueEnd |
路径。而不是定义路径,设置这些值以使注释可扩展 |
| xAxis yAxis |
轴索引,默认为0 |
| anchorX anchorY |
定义注释锚点,可用值:anchorX:“left”/“center”/“right”
anchorY:“top”/“middle”/“bottom”
|
| allowDragX allowDragY |
允许用户拖放注释。水平和垂直。 |
| linkedTo | 链接注释到点或系列使用它的id |
| title | 标题配置对象 |
| title.text | 标题文字 |
| title.x title.y |
相对于注释位置的标题位置(以像素为单位) |
| title.style | 标题的其他CSS样式 |
| title.style.color | 标题文字颜色 |
| title.style.fontSize | 标题字体大小 |
| shape | 形状配置对象 |
| shape.type | 形状类型,可用类型"path","circle"并且"rect" |
| shape.units | 定义形状是使用像素还是轴值 |
| shape.params | 形状参数(参数传递给渲染器方法,如rect,circle或path) |
| events | 支持的事件对象有:mouseover, mouseout, mousedown, mouseup, click, dblclick。this在回调中是指注释对象。 |
| selectionMarker | 所选注释的样式默认为: { 'stroke-width': 1, stroke: 'black', fill: 'transparent', dashstyle: 'ShortDash', 'shape-rendering': 'crispEdges' } |
可用的形状参数
| 选项 | 描述 | 仅限于 |
|---|---|---|
| shape.params.x shape.params.y |
相对于注释位置的形状位置 | 直角 圈 |
| shape.params.width shape.params.height |
矩形宽度和高度(仅适用于"rect"类型) |
矩形 |
| shape.params.d | 路径定义(仅适用于"path"类型) |
路径 |
| shape.params.r | 圆半径 | 圈 |
| shape.params.fill | 填充颜色,默认值: "transparent" |
- |
| shape.params.stroke | 笔画颜色,默认值: "black" |
- |
| shape.params.strokeWidth | 行程宽度(和路径的行宽),默认值: 2 |
- |
图表注释方法
| 属性 | 描述 |
|---|---|
| chart.addAnnotation(选项) | 添加一个带有给定选项的注释 |
| chart.redrawAnnotations() | 重绘所有注释 |
| chart.annotations.allItems | 包含所有注释的数组 |
注释对象方法
| 属性 | 描述 |
|---|---|
| annotation.update(选项) | 使用给定选项更新注释 |
| annotation.destroy() | 破坏注释 |
| annotation.show() | 显示注释 - 仅用于未链接的注释 |
| annotation.hide() | 隐藏注释 - 仅用于未链接的注释 |
| annotation.select() | 通过添加选择框选择注释 |
| annotation.deselect() | 通过删除选择框取消注释 |
图表注释配置
| 属性 | 描述 |
|---|---|
| enabledButtons | 启用或禁用用于绘制注释的按钮。 所选按钮防止缩放和平移以绘制注释。 |
| buttonsOffsets | 数组中按钮的偏移量:[x-offset, y-offset]。在导出模块旁边放置注释等时很有用。默认为[0, 0]。 |
| buttons | 按钮阵列 例如:
{
	annotationEvents:{step:callback,//在鼠标拖动期间调用新的注释stop:callback//在鼠标向上/释放之后被调用
	},annotation:{//标注注释选项,用于新的注释
		anchorX:'左',
		anchorY:'top',
		xAxis:0,
		yAxis:0,shape:{type:'path',params:{
				d:['M',0,0,'L',100,100]
			}
		}
	},symbol:{//按钮符号选项shape:'rect',//shape,取自Highcharts.s符号size:12,style:{
			'stroke-width':2,'stroke:'black'fill:'red',
			zIndex:121
		}
	},
	style:{// buton style本身fill:'black',stroke:blue
		strokeWidth:2,
	},
	size:12,// buton sizestates:{//按钮的状态 selected:{fill:'#9BD'
		},hover:{file:'#9BD'
		}
	}
}
|
这是从highcharts的官方插件自己学习了。
官方插件github地址:
https://github.com/blacklabel/annotations
大家可以下载源码测试一下。
谢谢。