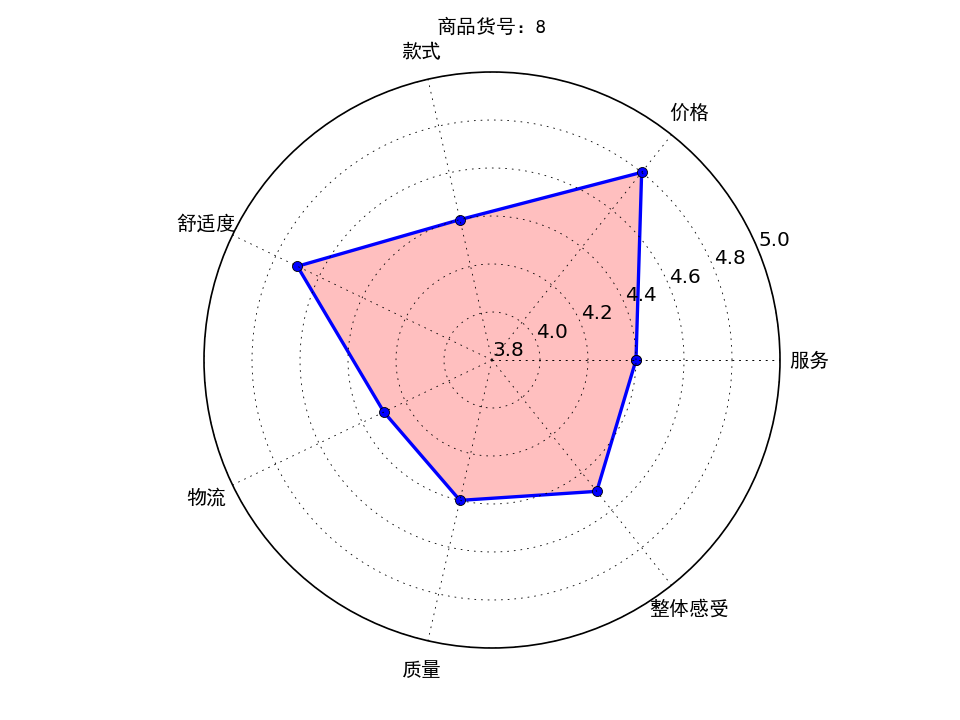
老板要画雷达图,但是数据好多组怎么办?不能一个一个点excel去画吧,那么可以利用python进行批量制作,得到样式如下:
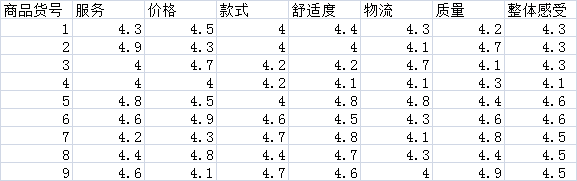
首先制作一个演示的excel,评分为excel随机数生成:
1 =INT((RAND()+4)*10)/10
加入标签等得到的excel样式如下(部分,共计32行):
那么接下来就是打开python写码了,本文是基于python3.4进行编写
 1 wb = load_workbook(filename=r'C:UsersAdministratorDesktop数据指标.xlsx')  ##读取路径
 2     ws = wb.get_sheet_by_name("Sheet1")  ##读取名字为Sheet1的sheet表
 3
 4     info_id = []
 5     info_first = []
 6
 7     for row_A in range(2, 32):  ## 遍历第2行到32行
 8         id = ws.cell(row=row_A, column=1).value  ## 遍历第2行到32行,第1列
 9         info_id.append(id)
10     for col in range(2, 9):  ##读取第1到9列
11         first = ws.cell(row=1, column=col).value
12         info_first.append(first)  ##得到1到8列的标签
13
14     info_data = []
15     for row_num_BtoU in range(2, len(info_id) + 2):  ## 遍历第2行到32行
16         row_empty = []  ##建立一个空数组作为临时储存地,每次换行就被清空
17         for i in range(2, 9):  ## 遍历第2行到32行,第2到9列
18             data_excel = ws.cell(row=row_num_BtoU, column=i).value
19             if data_excel == None:
20                 pass
21             else:
22                 row_empty.append(data_excel)  ##将单元格信息储存进去
23         info_data.append(row_empty)
分步讲解:
读取excel表格:
1   wb = load_workbook(filename=r'C:UsersAdministratorDesktop数据指标.xlsx')  ##读取路径
2     ws = wb.get_sheet_by_name("Sheet1")  ##读取名字为Sheet1的sheet表
需要用到库:
1 import xlsxwriter
1 from openpyxl import load_workbook
在命令指示符下输入:
1 pip install xlsxwriter
等待安装即可,后面的库也是如此:
将第一列ID储存,以及第一行的标签,标签下面的数值分别储存在:
    info_id = []
    info_first = []
    info_data = []
读取数据后接下来需要设置写入的格式:
1 workbook = xlsxwriter.Workbook('C:\Users\Administrator\Desktop\result.xlsx')
2     worksheet = workbook.add_worksheet()  # 创建一个工作表对象
3     #字体格式
4     font = workbook.add_format(
5         {'border': 1, 'align': 'center', 'font_size': 11, 'font_name': '微软雅黑'})  ##字体居中,11号,微软雅黑,给一般的信息用的
6     #写下第一行第一列的标签
7     worksheet.write(0, 0, '商品货号', font)
8     ##设置图片的那一列宽度
9     worksheet.set_column(0, len(info_first) + 1, 11)  # 设定第len(info_first) + 1列的宽度为11
将标签数据等写入新的excel表格中:
 1 #新建一个excel保存结果
 2     workbook = xlsxwriter.Workbook('C:\Users\Administrator\Desktop\result.xlsx')
 3     worksheet = workbook.add_worksheet()  # 创建一个工作表对象
 4     #字体格式
 5     font = workbook.add_format(
 6         {'border': 1, 'align': 'center', 'font_size': 11, 'font_name': '微软雅黑'})  ##字体居中,11号,微软雅黑,给一般的信息用的
 7     #写下第一行第一列的标签
 8     worksheet.write(0, 0, '商品货号', font)
 9     ##设置图片的那一列宽度
10     worksheet.set_column(0, len(info_first) + 1, 11)  # 设定第len(info_first) + 1列的宽度为11
11
12     ##写入标签
13     for k in range(0,7):
14         worksheet.write(0, k + 1, info_first[k], font)
15     #写入最后一列标签
16     worksheet.write(0, len(info_first) + 1, '雷达图', font)
制作雷达图:
 1     #设置雷达各个顶点的名称
 2     labels = np.array(info_first)
 3     #数据个数
 4     data_len = len(info_first)
 5     for i in range(0,len(info_id)):
 6         data = np.array(info_data[i])
 7
 8         angles = np.linspace(0, 2*np.pi, data_len, endpoint=False)
 9         data = np.concatenate((data, [data[0]])) # 闭合
10         angles = np.concatenate((angles, [angles[0]])) # 闭合
11
12         fig = plt.figure()
13         ax = fig.add_subplot(111, polar=True)# polar参数!!
14         ax.plot(angles, data, 'bo-', linewidth=2)# 画线
15         ax.fill(angles, data, facecolor='r', alpha=0.25)# 填充
16         ax.set_thetagrids(angles * 180/np.pi, labels, fontproperties="SimHei")
17         ax.set_title("商品货号:" + str(info_id[i]), va='bottom', fontproperties="SimHei")
18         ax.set_rlim(3.8,5)# 设置雷达图的范围
19         ax.grid(True)
20         plt.savefig("C:\Users\Administrator\Desktop\result\商品货号:" + str(info_id[i]) + ".png", dpi=120)
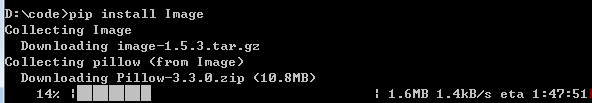
图片太大怎么办?用库改变大小即可:
 1         import Image
 2         ##更改图片大小
 3         infile = “C:\Users\Administrator\Desktop\result\商品货号:" + str(info_id[i]) + ".png“
 4         outfile = ”C:\Users\Administrator\Desktop\result1\商品货号:" + str(info_id[i]) + ".png”
 5         im = Image.open(infile)
 6         (x, y) = im.size
 7         x_s = 80    ## 设置长
 8         y_s = 100  ## 设置宽
 9         out = im.resize((x_s, y_s), Image.ANTIALIAS)
10         out.save(outfile,'png',quality = 95)
将大图片和小图片放在了result和result1两个不同的文件夹,需要再前边创建这两个文件夹:
 1     if os.path.exists(r'C:\Users\Administrator\Desktop\result'):  # 建立一个文件夹在桌面,文件夹为result
 2         print('result文件夹已经在桌面存在,继续运行程序……')
 3     else:
 4         print('result文件夹不在桌面,新建文件夹result')
 5         os.mkdir(r'C:\Users\Administrator\Desktop\result')
 6         print('文件夹建立成功,继续运行程序')
 7
 8     if os.path.exists(r'C:\Users\Administrator\Desktop\result1'):  # 建立一个文件夹在C盘,文件夹为result1
 9         print('result1文件夹已经在桌面存在,继续运行程序……')
10     else:
11         print('result1文件夹不在桌面,新建文件夹result1')
12         os.mkdir(r'C:\Users\Administrator\Desktop\result1')
13         print('文件夹建立成功,继续运行程序')
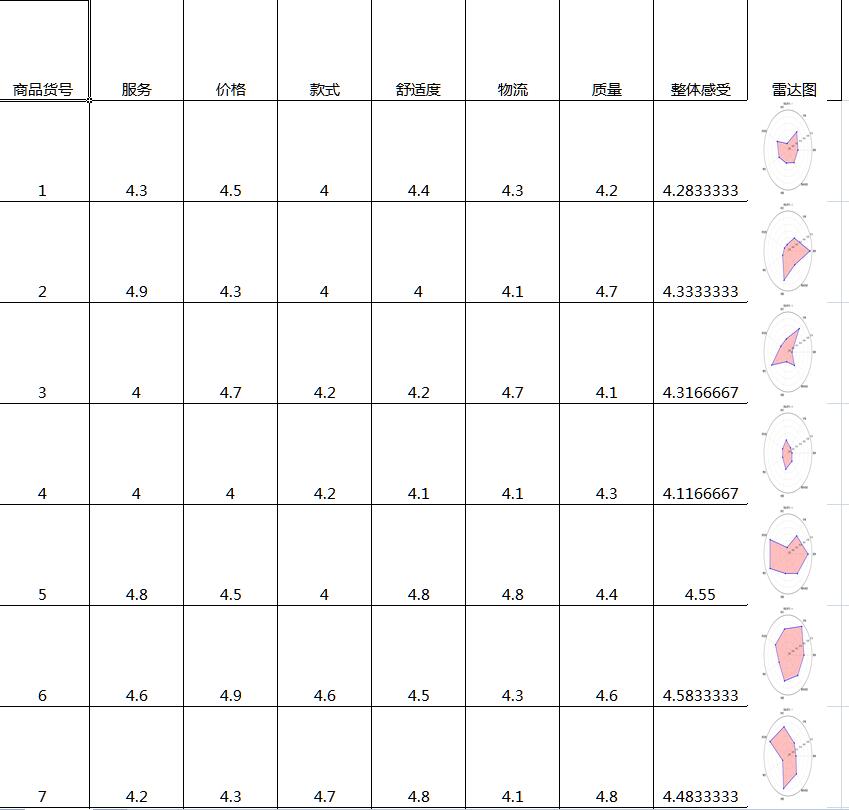
最后插入图片到excel中:
1         worksheet.insert_image(i + 1, len(info_first) + 1, 'C:\Users\Administrator\Desktop\result1\' + "商品货号:" + str(info_id[i]) + '.png')  ##写入图片
2         time.sleep(1)##防止写入太快电脑死机
3         plt.close() #   一定要关掉图片,不然python打开图片20个后会崩溃
4
5     workbook.close()#最后关闭excel
得到的效果如下:
附上完整代码:
  1 import numpy as np
  2 import matplotlib.pyplot as plt
  3 import xlsxwriter
  4 from openpyxl import load_workbook
  5 import os
  6 import time
  7 from PIL import Image
  8
  9 if __name__ == '__main__':
 10
 11     if os.path.exists(r'C:\Users\Administrator\Desktop\result'):  # 建立一个文件夹在桌面,文件夹为result
 12         print('result文件夹已经在桌面存在,继续运行程序……')
 13     else:
 14         print('result文件夹不在桌面,新建文件夹result')
 15         os.mkdir(r'C:\Users\Administrator\Desktop\result')
 16         print('文件夹建立成功,继续运行程序')
 17
 18     if os.path.exists(r'C:\Users\Administrator\Desktop\result1'):  # 建立一个文件夹在C盘,文件夹为result1
 19         print('result1文件夹已经在桌面存在,继续运行程序……')
 20     else:
 21         print('result1文件夹不在桌面,新建文件夹result1')
 22         os.mkdir(r'C:\Users\Administrator\Desktop\result1')
 23         print('文件夹建立成功,继续运行程序')
 24
 25     wb = load_workbook(filename=r'C:UsersAdministratorDesktop数据指标.xlsx')  ##读取路径
 26     ws = wb.get_sheet_by_name("Sheet1")  ##读取名字为Sheet1的sheet表
 27
 28     info_id = []
 29     info_first = []
 30
 31     for row_A in range(2, 32):  ## 遍历第2行到32行
 32         id = ws.cell(row=row_A, column=1).value  ## 遍历第2行到32行,第1列
 33         info_id.append(id)
 34     for col in range(2, 9):  ##读取第1到9列
 35         first = ws.cell(row=1, column=col).value
 36         info_first.append(first)  ##得到1到8列的标签
 37     print(info_id)
 38     print(info_first)
 39
 40     info_data = []
 41     for row_num_BtoU in range(2, len(info_id) + 2):  ## 遍历第2行到32行
 42         row_empty = []  ##建立一个空数组作为临时储存地,每次换行就被清空
 43         for i in range(2, 9):  ## 遍历第2行到32行,第2到9列
 44             data_excel = ws.cell(row=row_num_BtoU, column=i).value
 45             if data_excel == None:
 46                 pass
 47             else:
 48                 row_empty.append(data_excel)  ##将单元格信息储存进去
 49         info_data.append(row_empty)
 50     print(info_data)
 51     print(len(info_data))
 52
 53     # 设置雷达各个顶点的名称
 54     labels = np.array(info_first)
 55     # 数据个数
 56     data_len = len(info_first)
 57     # 新建一个excel保存结果
 58     workbook = xlsxwriter.Workbook('C:\Users\Administrator\Desktop\result.xlsx')
 59     worksheet = workbook.add_worksheet()  # 创建一个工作表对象
 60     # 字体格式
 61     font = workbook.add_format(
 62         {'border': 1, 'align': 'center', 'font_size': 11, 'font_name': '微软雅黑'})  ##字体居中,11号,微软雅黑,给一般的信息用的
 63     # 写下第一行第一列的标签
 64     worksheet.write(0, 0, '商品货号', font)
 65     ##设置图片的那一列宽度
 66     worksheet.set_column(0, len(info_first) + 1, 11)  # 设定第len(info_first) + 1列的宽度为11
 67
 68     ##写入标签
 69     for k in range(0, 7):
 70         worksheet.write(0, k + 1, info_first[k], font)
 71     # 写入最后一列标签
 72     worksheet.write(0, len(info_first) + 1, '雷达图', font)
 73
 74     # 将其他参数写入excel中
 75     for j in range(0, len(info_id)):
 76         worksheet.write(j + 1, 0, info_id[j], font)  # 写入商品货号
 77         worksheet.set_row(j, 76)  ##设置行宽
 78         for x in range(0, len(info_first)):
 79             worksheet.write(j + 1, x + 1, info_data[j][x], font)  # 写入商品的其他参数
 80
 81     for i in range(0, len(info_id)):
 82         data = np.array(info_data[i])
 83
 84         angles = np.linspace(0, 2 * np.pi, data_len, endpoint=False)
 85         data = np.concatenate((data, [data[0]]))  # 闭合
 86         angles = np.concatenate((angles, [angles[0]]))  # 闭合
 87
 88         fig = plt.figure()
 89         ax = fig.add_subplot(111, polar=True)  # polar参数!!
 90         ax.plot(angles, data, 'bo-', linewidth=2)  # 画线
 91         ax.fill(angles, data, facecolor='r', alpha=0.25)  # 填充
 92         ax.set_thetagrids(angles * 180 / np.pi, labels, fontproperties="SimHei")
 93         ax.set_title("商品货号:" + str(info_id[i]), va='bottom', fontproperties="SimHei")
 94         ax.set_rlim(3.8, 5)  # 设置雷达图的范围
 95         ax.grid(True)
 96         plt.savefig("C:\Users\Administrator\Desktop\result\商品货号:" + str(info_id[i]) + ".png", dpi=120)
 97         # plt.show()在python中显示
 98
 99         ##更改图片大小
100         infile = "C:\Users\Administrator\Desktop\result\商品货号:" + str(info_id[i]) + ".png"
101         outfile = "C:\Users\Administrator\Desktop\result1\商品货号:" + str(info_id[i]) + ".png"
102         im = Image.open(infile)
103         (x, y) = im.size
104         x_s = 80  ## 设置长
105         y_s = 100  ## 设置宽
106         out = im.resize((x_s, y_s), Image.ANTIALIAS)
107         out.save(outfile, 'png', quality=95)
108
109         worksheet.insert_image(i + 1, len(info_first) + 1,
110                                'C:\Users\Administrator\Desktop\result1\' + "商品货号:" + str(
111                                    info_id[i]) + '.png')  ##写入图片
112         time.sleep(1)  ##防止写入太快电脑死机
113         plt.close()  # 一定要关掉图片,不然python打开图片20个后会崩溃
114
115     workbook.close()  # 最后关闭excel