Windows下Anaconda中tensorflow的tensorboard使用(实测)
一、总结
一句话总结:
1、监听目录:Listen logdir
2、创建summary实例:build summary instance
3、给summary instance喂数据:fed data into summary instance
1、TensorBoard 监听目录(第一步)代码及例子?
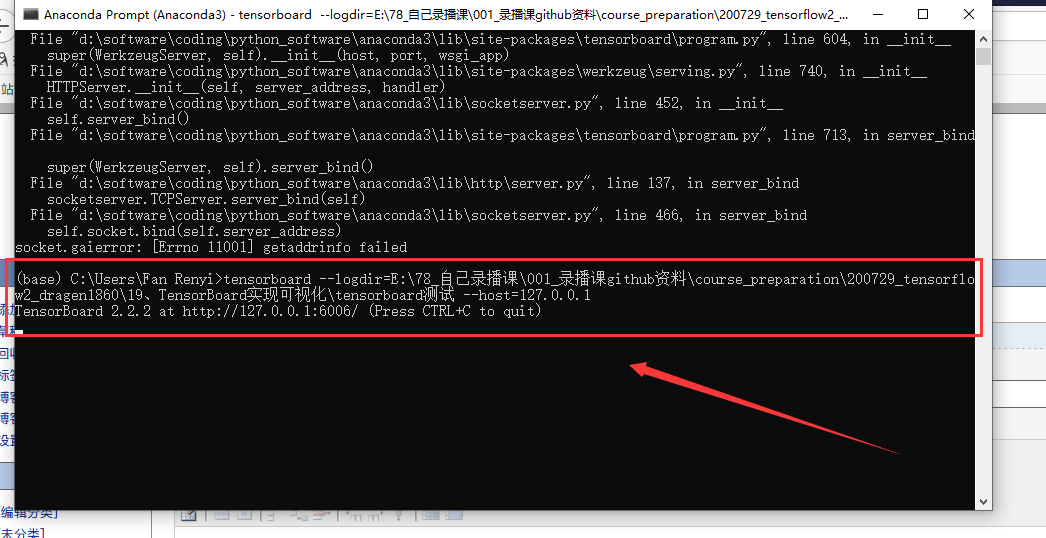
tensorboard --logdir=所在位置(不加引号) --host=127.0.0.1
tensorboard --logdir=E:78_自己录播课�01_录播课github资料course_preparation200729_tensorflow2_dragen186019、TensorBoard实现可视化 ensorboard测试 --host=127.0.0.1
2、TensorBoard 创建summary实例(第二步) 代码?
summary_writer = tf.summary.create_file_writer(log_dir)
# 创建summary_writer,来feed数据
current_time = datetime.datetime.now().strftime("%Y%m%d-%H%M%S")
log_dir = 'logs/' + current_time
summary_writer = tf.summary.create_file_writer(log_dir)
3、TensorBoard 给summary instance喂数据(第三步) 实例?
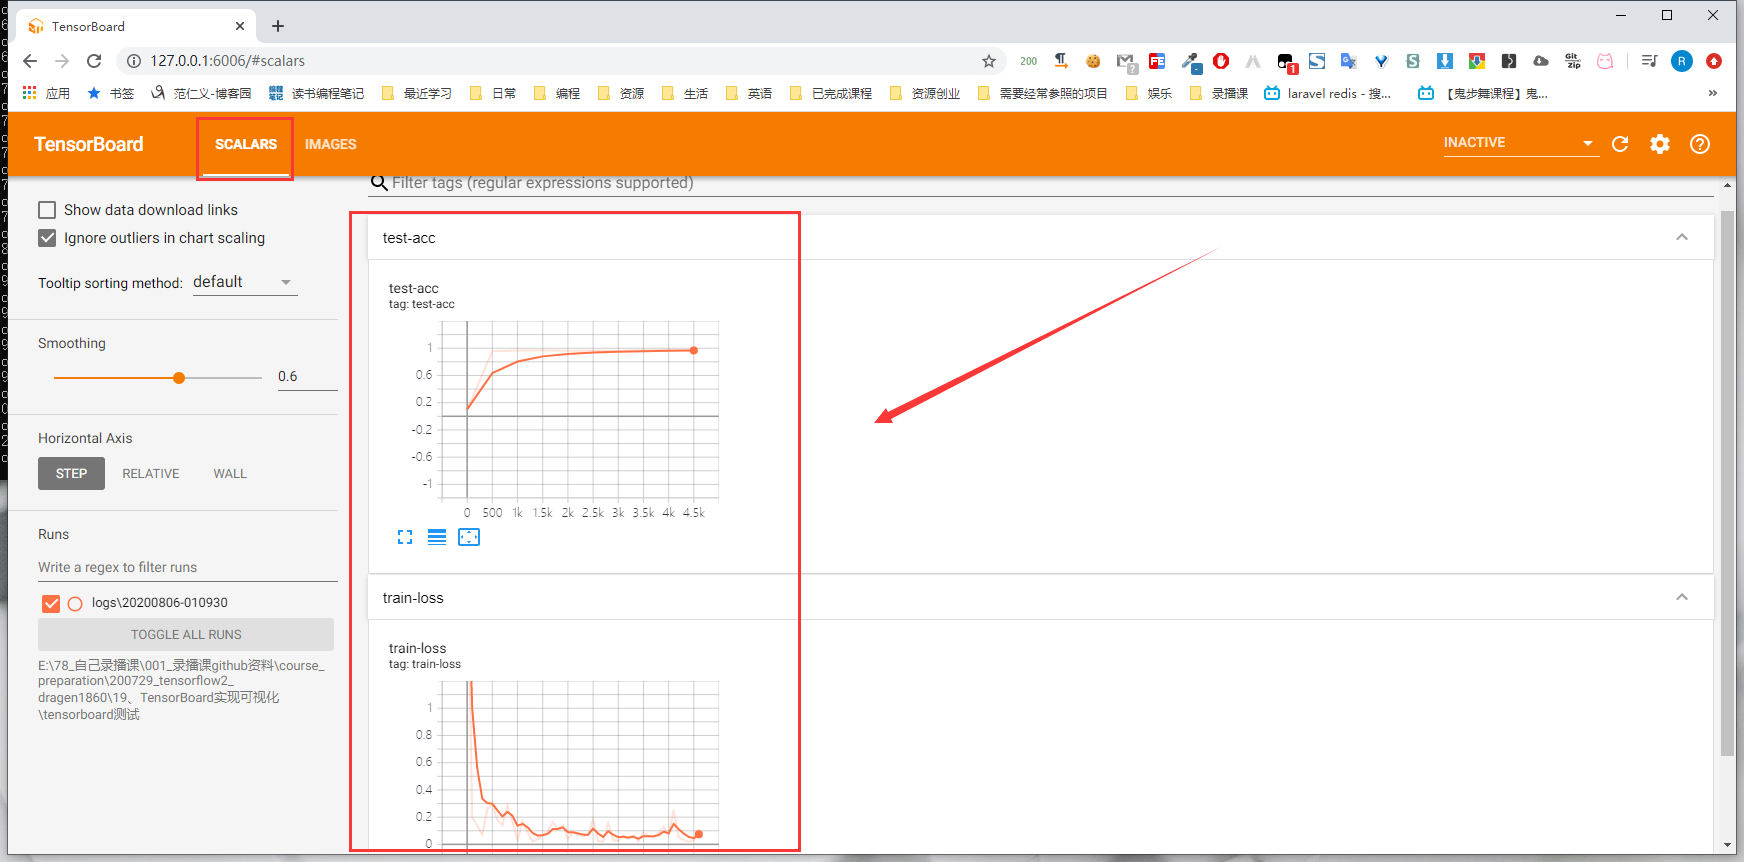
喂标量:with summary_writer.as_default(): tf.summary.scalar('train-loss', float(loss), step=step)
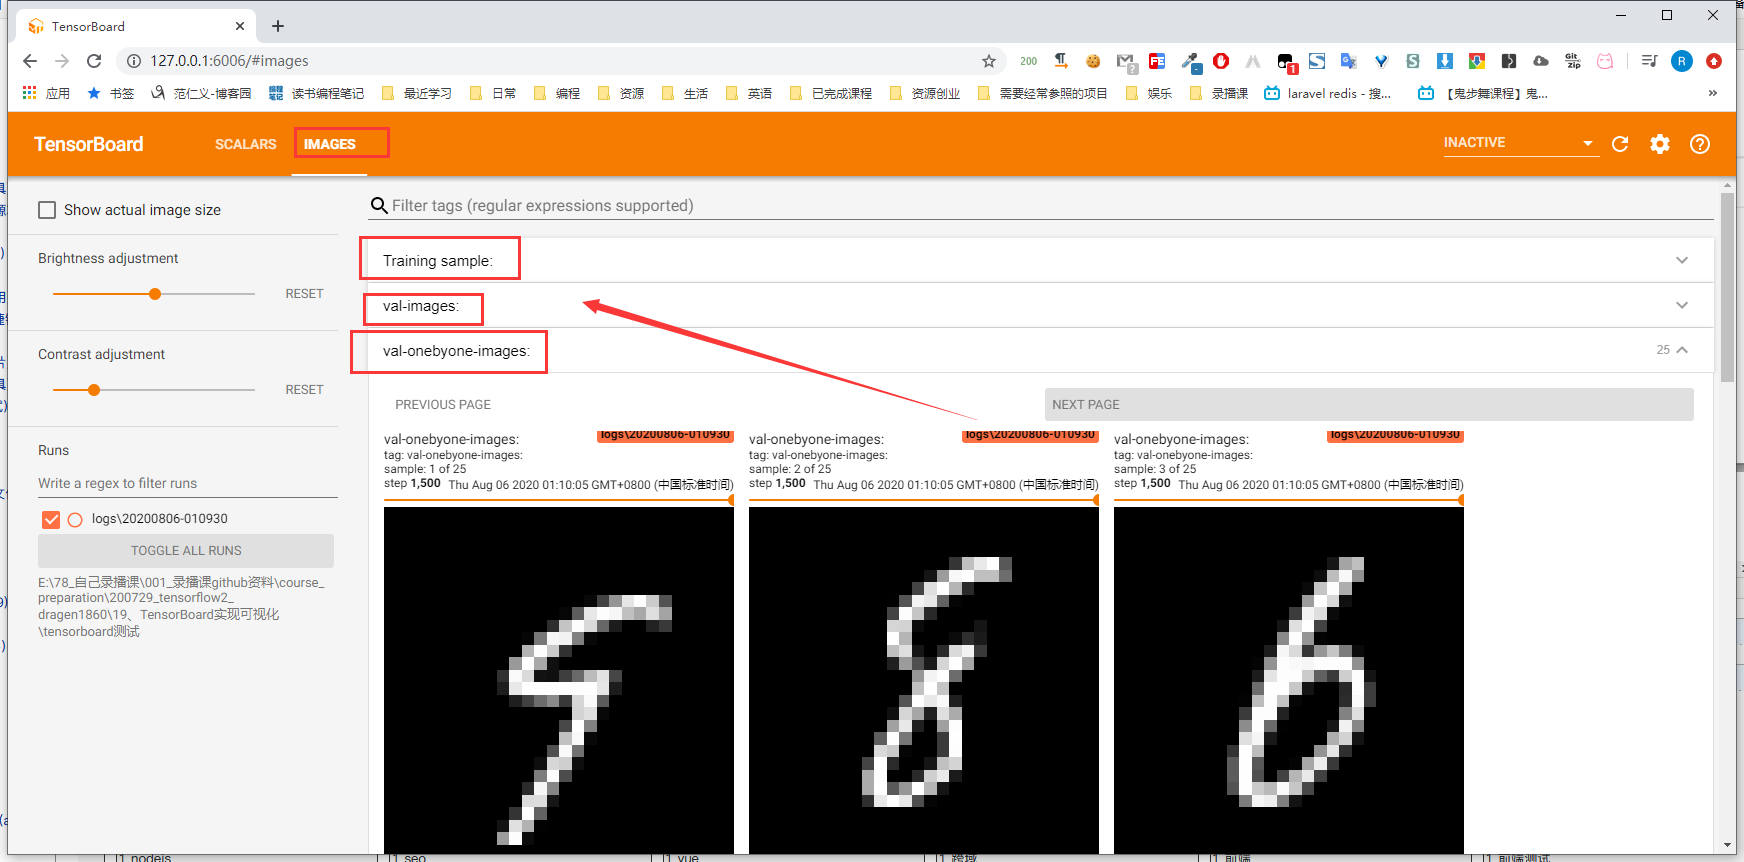
喂图片:with summary_writer.as_default(): tf.summary.image("Training sample:", sample_img, step=0)
二、Windows下Anaconda中tensorflow的tensorboard使用(实测)
博客对应课程的视频位置:
1、监听目录:Listen logdir
tensorboard --logdir=所在位置(不加引号) --host=127.0.0.1
tensorboard --logdir=E:78_自己录播课�01_录播课github资料course_preparation200729_tensorflow2_dragen186019、TensorBoard实现可视化 ensorboard测试 --host=127.0.0.1

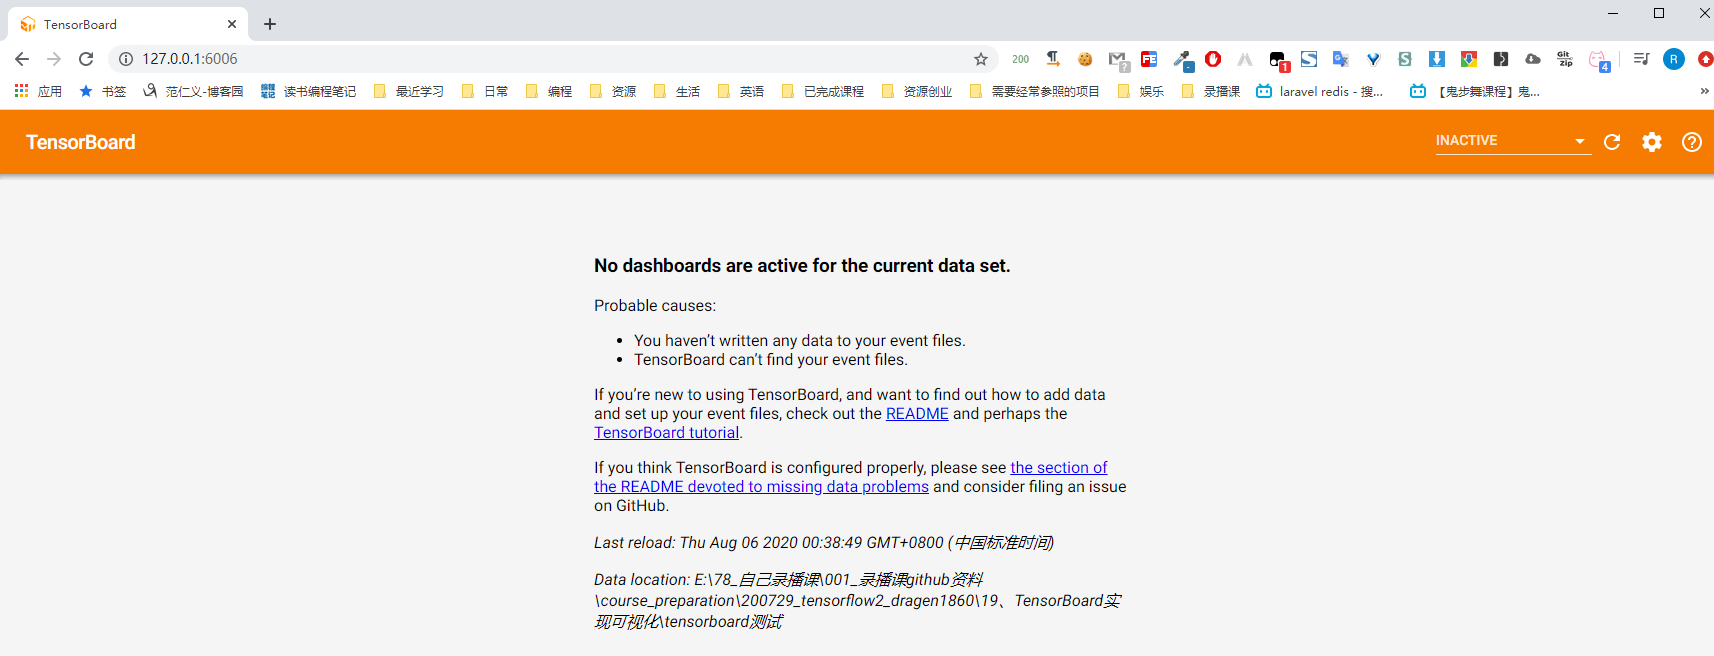
现在还 没数据

2、创建summary实例:build summary instance

3、给summary instance喂数据:fed data into summary instance
标量

代码
import  os
os.environ['TF_CPP_MIN_LOG_LEVEL']='2'

import  tensorflow as tf
from    tensorflow.keras import datasets, layers, optimizers, Sequential, metrics
import  datetime
from    matplotlib import pyplot as plt
import  io

assert tf.__version__.startswith('2.')

# 归一化处理
def preprocess(x, y):

    x = tf.cast(x, dtype=tf.float32) / 255.
    y = tf.cast(y, dtype=tf.int32)

    return x,y

# 画图
def plot_to_image(figure):
  """Converts the matplotlib plot specified by 'figure' to a PNG image and
  returns it. The supplied figure is closed and inaccessible after this call."""
  # Save the plot to a PNG in memory.
  buf = io.BytesIO()
  plt.savefig(buf, format='png')
  # Closing the figure prevents it from being displayed directly inside
  # the notebook.
  plt.close(figure)
  buf.seek(0)
  # Convert PNG buffer to TF image
  image = tf.image.decode_png(buf.getvalue(), channels=4)
  # Add the batch dimension
  image = tf.expand_dims(image, 0)
  return image

# 以网格的方式来画图
def image_grid(images):
  """Return a 5x5 grid of the MNIST images as a matplotlib figure."""
  # Create a figure to contain the plot.
  figure = plt.figure(figsize=(10,10))
  for i in range(25):
    # Start next subplot.
    plt.subplot(5, 5, i + 1, title='name')
    plt.xticks([])
    plt.yticks([])
    plt.grid(False)
    plt.imshow(images[i], cmap=plt.cm.binary)

  return figure


batchsz = 128
(x, y), (x_val, y_val) = datasets.mnist.load_data()
print('datasets:', x.shape, y.shape, x.min(), x.max())


db = tf.data.Dataset.from_tensor_slices((x,y))
db = db.map(preprocess).shuffle(60000).batch(batchsz).repeat(10)

ds_val = tf.data.Dataset.from_tensor_slices((x_val, y_val))
ds_val = ds_val.map(preprocess).batch(batchsz, drop_remainder=True)


# 创建model
network = Sequential([layers.Dense(256, activation='relu'),
                     layers.Dense(128, activation='relu'),
                     layers.Dense(64, activation='relu'),
                     layers.Dense(32, activation='relu'),
                     layers.Dense(10)])
network.build(input_shape=(None, 28*28))
network.summary()

optimizer = optimizers.Adam(lr=0.01)


# 创建summary_writer,来feed数据
current_time = datetime.datetime.now().strftime("%Y%m%d-%H%M%S")
log_dir = 'logs/' + current_time
summary_writer = tf.summary.create_file_writer(log_dir)

# get x from (x,y)
sample_img = next(iter(db))[0]
# get first image instance
sample_img = sample_img[0]
sample_img = tf.reshape(sample_img, [1, 28, 28, 1])
with summary_writer.as_default():
    tf.summary.image("Training sample:", sample_img, step=0)


for step, (x,y) in enumerate(db):

    with tf.GradientTape() as tape:
        # [b, 28, 28] => [b, 784]
        x = tf.reshape(x, (-1, 28*28))
        # [b, 784] => [b, 10]
        out = network(x)
        # [b] => [b, 10]
        y_onehot = tf.one_hot(y, depth=10)
        # [b]
        loss = tf.reduce_mean(tf.losses.categorical_crossentropy(y_onehot, out, from_logits=True))


    grads = tape.gradient(loss, network.trainable_variables)
    optimizer.apply_gradients(zip(grads, network.trainable_variables))


    # 每隔100喂loss
    if step % 100 == 0:

        print(step, 'loss:', float(loss))
        with summary_writer.as_default():
            tf.summary.scalar('train-loss', float(loss), step=step)

    # evaluate
    if step % 500 == 0:
        total, total_correct = 0., 0

        for _, (x, y) in enumerate(ds_val):
            # [b, 28, 28] => [b, 784]
            x = tf.reshape(x, (-1, 28*28))
            # [b, 784] => [b, 10]
            out = network(x)
            # [b, 10] => [b]
            pred = tf.argmax(out, axis=1)
            pred = tf.cast(pred, dtype=tf.int32)
            # bool type
            correct = tf.equal(pred, y)
            # bool tensor => int tensor => numpy
            total_correct += tf.reduce_sum(tf.cast(correct, dtype=tf.int32)).numpy()
            total += x.shape[0]

        print(step, 'Evaluate Acc:', total_correct/total)


        # print(x.shape)
        val_images = x[:25]
        val_images = tf.reshape(val_images, [-1, 28, 28, 1])
        with summary_writer.as_default():
            tf.summary.scalar('test-acc', float(total_correct/total), step=step)
            tf.summary.image("val-onebyone-images:", val_images, max_outputs=25, step=step)

            val_images = tf.reshape(val_images, [-1, 28, 28])
            figure  = image_grid(val_images)
            tf.summary.image('val-images:', plot_to_image(figure), step=step)
代码结果
其实就是将下面一堆数据显示在图上(当然是代码中监听的数据)
datasets: (60000, 28, 28) (60000,) 0 255
Model: "sequential_1"
_________________________________________________________________
Layer (type)                 Output Shape              Param #
=================================================================
dense_5 (Dense)              multiple                  200960
_________________________________________________________________
dense_6 (Dense)              multiple                  32896
_________________________________________________________________
dense_7 (Dense)              multiple                  8256
_________________________________________________________________
dense_8 (Dense)              multiple                  2080
_________________________________________________________________
dense_9 (Dense)              multiple                  330
=================================================================
Total params: 244,522
Trainable params: 244,522
Non-trainable params: 0
_________________________________________________________________
0 loss: 2.333691120147705
0 Evaluate Acc: 0.10266426282051282
100 loss: 0.195974200963974
200 loss: 0.13933685421943665
300 loss: 0.0710151270031929
400 loss: 0.2614491879940033
500 loss: 0.2935820519924164
500 Evaluate Acc: 0.9557291666666666
600 loss: 0.1792612373828888
700 loss: 0.14009886980056763
800 loss: 0.28799229860305786
900 loss: 0.1667361557483673
1000 loss: 0.028745872899889946
1000 Evaluate Acc: 0.9670472756410257
1100 loss: 0.17024189233779907
1200 loss: 0.08932852745056152
1300 loss: 0.01985497586429119
1400 loss: 0.03687073290348053
1500 loss: 0.07085257768630981
1500 Evaluate Acc: 0.9694511217948718
1600 loss: 0.09304299205541611
1700 loss: 0.1651502549648285
1800 loss: 0.1155177503824234
1900 loss: 0.13984549045562744
2000 loss: 0.03880707547068596
2000 Evaluate Acc: 0.9643429487179487
2100 loss: 0.08806708455085754
2200 loss: 0.06834998726844788
2300 loss: 0.058198075741529465
2400 loss: 0.06798434257507324
2500 loss: 0.18517211079597473
2500 Evaluate Acc: 0.9668469551282052
2600 loss: 0.02543201670050621
2700 loss: 0.01642942801117897
2800 loss: 0.1596240997314453
2900 loss: 0.030694836750626564
3000 loss: 0.02733795903623104
3000 Evaluate Acc: 0.9642427884615384
3100 loss: 0.06085292994976044
3200 loss: 0.04173851013183594
3300 loss: 0.06633666902780533
3400 loss: 0.019860271364450455
3500 loss: 0.08818966895341873
3500 Evaluate Acc: 0.9698517628205128
3600 loss: 0.057221196591854095
3700 loss: 0.05801805108785629
3800 loss: 0.08152905106544495
3900 loss: 0.13136368989944458
4000 loss: 0.06399617344141006
4000 Evaluate Acc: 0.9697516025641025
4100 loss: 0.25367021560668945
4200 loss: 0.05269865691661835
4300 loss: 0.03205656632781029
4400 loss: 0.018105076625943184
4500 loss: 0.03212927654385567
4500 Evaluate Acc: 0.9736578525641025
4600 loss: 0.11721880733966827
运行代码之后,可以看到在目录下生成了如下文件


