HighCharts使用心得
前言:
之前很早的一个项目中使用过highcharts,感觉挺方便的,图表类型也比较丰富,而且还支持数据的下钻,但是如果投入商业使用的话还会有一些版权的问题,所以后来就使用了EChart,这是百度开发的一个开源的图表插件,图表类型也很丰富,而且还有交互,对地图的支持也很好,可以免费的使用。在之前的一篇文章里,已经总结过了,今天主要跟大家分享一下,之前总结的Highcharts的一些使用心得,希望能够对大家有所帮助。
1. 准备工作------下载HighCharts插件
跟ECharts一样,HighCharts也需要下载相应的插件,不过HightCharts的插件很简单,只有一个highcharts.js文件。可以从HighCharts官网上下载,具体地址如下:http://www.highcharts.com/download
另注:
如果需要导出图表,则需要exporting.js文件
如果需要一些特殊的图形呈现,则还需要下载highcharts-more.js
2. 新建一个解决方案或网站,引用下载的highcharts.js文件,进行图表展示。
在这个过程中,我会逐步的跟大家讲解如何使用highcharts.js进行图表展示。
2.1 新建解决方案(或网站),目录结构如下

另注:
一般情况下如果不需要导出图片、且只使用常规的图形,exportting.js和highchart-more.js可以不要,只留一个highcharts.js文件即可。
其中的HighCharts.js文件为我自己总结的使用帮助文件,主要用来配置图表类型、图表数据的处理、格式化等操作,下边会进一步讲解。
此外需要注意的是这里引用的Jquery文件版本为最近版本,VS里边默认的为1.4.1的版本太低,最新的highcharts需要高版本的jQuery文件。
2.2 HighChart.js文件介绍
在2.1中对此文件有一个初步的介绍,这一小节里专门来介绍这个文件。该文件的主要功能是用来配置各种图表类型的配置项,同时对用户提供的参数进行格式化、图表的呈现等功能。
文件的目录结构如下:
var HighChart = {

    ChartDataFormate: {//数据格式化

        FormateNOGroupData: function (data) {//处理不分组的数据

            var categories = [];

            var datas = [];

            for (var i = 0; i < data.length; i++) {

                categories.push(data[i].name || "");

                datas.push([data[i].name, data[i].value || 0]);

            }

            return { category: categories, data: datas };

        },…………

       },

    ChartOptionTemplates: {//图表配置项

        Pie: function (data, name, title) {

            var pie_datas = HighChart.ChartDataFormate.FormateNOGroupData(data);

            var option = {

                chart: {

                    plotBackgroundColor: null,

                    plotBorderWidth: null,

                    plotShadow: false

                },

               …….

            };

            return option;

        },

    RenderChart: function (option, container) {//页面渲染

        container.highcharts(option);

    }
完整代码:
//document.write("<script language='javascript' src='/Scripts/jquery-1.11.0.min.js'></script>");//引入Jquery(1.8.0以上版本)
//document.write("<script language='javascript' src='/Statics/highcharts.js'></script>"); //引入hightcharts引擎
//document.write("<script language='javascript' src='/Statics/exporting.js'></script>"); //引入导出图片js
//判断数组中是否包含某个元素
Array.prototype.contains = function (obj) {
var i = this.length;
while (i--) {
if (this[i] === obj) {
return true;
}
}
return false;
}
var HighChart = {
ChartDataFormate: {
FormateNOGroupData: function (data) {
var categories = [];
var datas = [];
for (var i = 0; i < data.length; i++) {
categories.push(data[i].name || "");
datas.push([data[i].name, data[i].value || 0]);
}
return { category: categories, data: datas };
},
FormatGroupData: function (data) {//处理分组数据,数据格式:name:XXX,group:XXX,value:XXX用于折线图、柱形图(分组,堆积)
var names = new Array();
var groups = new Array();
var series = new Array();
for (var i = 0; i < data.length; i++) {
if (!names.contains(data[i].name))
names.push(data[i].name);
if (!groups.contains(data[i].group))
groups.push(data[i].group);
}
for (var i = 0; i < groups.length; i++) {
var temp_series = {};
var temp_data = new Array();
for (var j = 0; j < data.length; j++) {
for (var k = 0; k < names.length; k++)
if (groups[i] == data[j].group && data[j].name == names[k])
temp_data.push(data[j].value);
}
temp_series = { name: groups[i], data: temp_data };
series.push(temp_series);
}
return { category: names, series: series };
},
FormatBarLineData: function (data, name, name1) {//数据类型:name:XXX,value:XXX,处理结果主要用来展示X轴为日期的具有增幅的趋势的图
var category = [];
var series = [];
var s1 = [];
var s2 = [];
for (var i = 1; i < data.length; i++) {
if (!category.contains(data[i].name))
category.push(data[i].name);
s1.push(data[i].value);
var growth = 0;
if (data[i].value != data[i - 1].value)
if (data[i - 1].value != 0)
growth = Math.round((data[i].value / data[i - 1].value - 1) * 100);
else
growth = 100;
s2.push(growth);
}
series.push({ name: name, color: '#4572A7', type: 'column', yAxis: 1, data: s1, tooltip: { valueStuffix: ''} });
series.push({ name: name1, color: '#89A54E', type: 'spline', yAxis: 1, data: s2, tooltip: { valueStuffix: '%'} });
return { series: series };
}
},
ChartOptionTemplates: {
Pie: function (data, name, title) {
var pie_datas = HighChart.ChartDataFormate.FormateNOGroupData(data);
var option = {
chart: {
plotBackgroundColor: null,
plotBorderWidth: null,
plotShadow: false
},
title: {
text: title || ''
},
tooltip: {
pointFormat: '{series.name}: <b>{point.percentage:.1f}%</b>'
},
plotOptions: {
pie: {
allowPointSelect: true,
cursor: 'pointer',
dataLabels: {
enabled: false
},
showInLegend: true
}
},
series: [{
type: 'pie',
name: name || '',
data: pie_datas.data
}]
};
return option;
},
DrillDownPie: function (data, name, title) {
var drilldownpie_datas;
var option = {
chart: {
type: 'pie'
},
title: {
text: title || ''
},
subtitle: {
text: '请点击饼图项看详细占比'
},
plotOptions: {
series: {
dataLabels: {
enabled: true,
format: '{point.name}: {point.y:.1f}%'
}
}
},
tooltip: {
headerFormat: '<span style="font-size:11px">{series.name}</span><br>',
pointFormat: '<span style="color:{point.color}">{point.name}</span>: <b>{point.y:.2f}%</b> of total<br/>'
},
series: [{
name: name || '',
colorByPoint: true,
data: drilldownpie_datas.fir_data
}],
drilldown: {
series: drilldownpie_datas.series
}
};
return option;
},
Line: function (data, name, title) {
var line_datas = HighChart.ChartDataFormate.FormatGroupData(data);
var option = {
title: {
text: title || '',
x: -20
},
subtitle: {
text: '',
x: -20
},
xAxis: {
categories: line_datas.category
},
yAxis: {
title: {
text: name || ''
},
plotLines: [{
value: 0,
1,
color: '#808080'
}]
},
tooltip: {
valueSuffix: ''
},
legend: {
layout: 'horizontal',
align: 'center',
verticalAlign: 'bottom'
},
series: line_datas.series
};
return option;
},
Bars: function (data, is_stack, is_stack_percent, name, title) {
var bars_datas = HighChart.ChartDataFormate.FormatGroupData(data);
var option = {
chart: {
type: 'column'
},
title: {
text: title || ''
},
subtitle: {
text: ''
},
credits: {
enabled: false
},
xAxis: {
categories: bars_datas.category
},
yAxis: {
//min: 0,
title: {
text: name
}
},
tooltip: {
headerFormat: '<span style="font-size:10px">{point.key}</span><table>',
pointFormat: '<tr><td style="color:{series.color};padding:0">{series.name};</td>' +
'<td style="padding:0"><b>{point.y:.1f}</b></td></tr>',
footerFormat: '</table>',
shared: true,
useHTML: true
},
plotOptions: {
column: {
pointPadding: 0.2,
borderWidth: 0
}
},
series: bars_datas.series
};
var stack_option = {};
if (is_stack && !is_stack_percent) {
stack_option = {
tooltip: {
formatter: function () {
return '<b>' + this.x + '</b><br/>' +
this.series.name + ': ' + this.y + '<br/>' +
'Total: ' + this.point.stackTotal;
}
},
plotOptions: {
column: {
stacking: 'normal',
dataLabels: {
enabled: true,
color: (Highcharts.theme && Highcharts.theme.dataLabelsColor) || 'white'
}
}
}
};
}
if (!is_stack && is_stack_percent) {
stack_option = {
tooltip: {
pointFormat: '<span style="color:{series.color}">{series.name}</span>: <b>{point.y}</b> ({point.percentage:.0f}%)<br/>',
shared: true
},
plotOptions: {
column: {
stacking: 'percent'
}
}
};
}
return $.extend({}, option, stack_option);
},
Pyramid: function (data, name, title) {
var pyramid_datas = HighChart.ChartDataFormate.FormateNOGroupData(data);
var option = {
chart: {
type: 'pyramid',
marginRight: 100
},
title: {
text: title || '',
x: -50
},
plotOptions: {
series: {
dataLabels: {
enabled: true,
format: '<b>{point.name}</b> ({point.y:,.0f})',
color: 'black',
softConnector: true
}
}
},
legend: {
enabled: false
},
series: [{
name: name || '',
data: pyramid_datas.data
}]
};
return option;
},
BarLine: function (data, name, name1, title) {
var barline_datas = HighChart.ChartDataFormate.FormatBarLineData(data);
var option = {
chart: {
zoomType: 'xy'
},
title: {
text: title || ''
},
subtitle: {
text: ''
},
xAxis: [{
categories: barline_datas.category
}],
yAxis: [{ // Primary yAxis
labels: {
format: '{value}',
style: {
color: '#89A54E'
}
},
title: {
text: name || '',
style: {
color: '#89A54E'
}
}
}, { // Secondary yAxis
title: {
text: name1 || '',
style: {
color: '#4572A7'
}
},
labels: {
format: '{value}',
style: {
color: '#4572A7'
}
},
opposite: true
}],
tooltip: {
shared: true
},
legend: {
layout: 'horizontal',
align: 'center',
verticalAlign: 'bottom'
},
series: [{
name: 'Rainfall',
color: '#4572A7',
type: 'column',
yAxis: 1,
data: [49.9, 71.5, 106.4, 129.2, 144.0, 176.0, 135.6, 148.5, 216.4, 194.1, 95.6, 54.4],
tooltip: {
valueSuffix: ' mm'
}
}, {
name: 'Temperature',
color: '#89A54E',
type: 'spline',
data: [7.0, 6.9, 9.5, 14.5, 18.2, 21.5, 25.2, 26.5, 23.3, 18.3, 13.9, 9.6],
tooltip: {
valueSuffix: '°C'
}
}]
};
}
},
RenderChart: function (option, container) {
container.highcharts(option);
}
};
2.3 具体的页面展示
2.3.1 饼图
l 页面引用
     <script src="../Scripts/jquery-1.11.0.min.js" type="text/javascript"></script>

    <script src="../Statics/highcharts.js" type="text/javascript"></script>

    <script src="../Statics/exporting.js" type="text/javascript"></script>

    <script src="../Statics/HighChart.js" type="text/javascript"></script>

    <script type="text/javascript">

        $(function () {

            var data = [{ name: 'olive', value: 116 }, { name: 'momo', value: 115 }, { name: 'only', value: 222 }, { name: 'for', value: 324}];

            var opt = HighChart.ChartOptionTemplates.Pie(data,'Love-Rate',"饼图示例");

            var container = $("#container");

            HighChart.RenderChart(opt, container);

        });

    </script>
l 效果展示

2.3.2 折线图
l 页面引用
<script src="../Scripts/jquery-1.11.0.min.js" type="text/javascript"></script>

    <script src="../Statics/highcharts.js" type="text/javascript"></script>

    <script src="../Statics/exporting.js" type="text/javascript"></script>

    <script src="../Statics/HighChart.js" type="text/javascript"></script>

    <script type="text/javascript">

        $(function () {

            var data = [

            { name: '2013-01', group: 'olive', value: 116 },

            { name: '2013-01', group: 'momo', value: 115 },

            { name: '2013-01', group: 'only', value: 222 },

            { name: '2013-01', group: 'for', value: 324 },

            { name: '2013-02', group: 'olive', value: 156 },

            { name: '2013-02', group: 'momo', value: 185 },

            { name: '2013-02', group: 'only', value: 202 },

            { name: '2013-02', group: 'for', value: 34 },

            { name: '2013-03', group: 'olive', value: 16 },

            { name: '2013-03', group: 'momo', value: 51 },

            { name: '2013-03', group: 'only', value: 22 },

            { name: '2013-03', group: 'for', value: 84 }

            ];

            var opt = HighChart.ChartOptionTemplates.Line(data, 'Love-Rate', "折线图示例");

            var container = $("#container");

            HighChart.RenderChart(opt, container);

        });

    </script>
l 效果展示

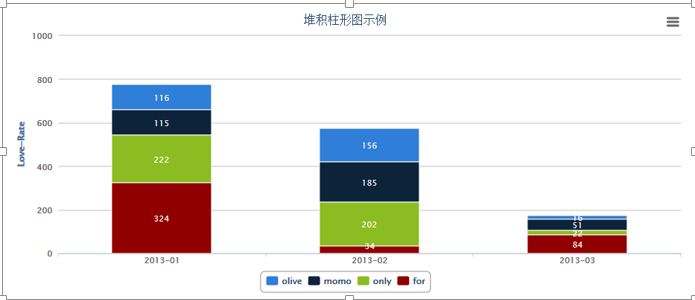
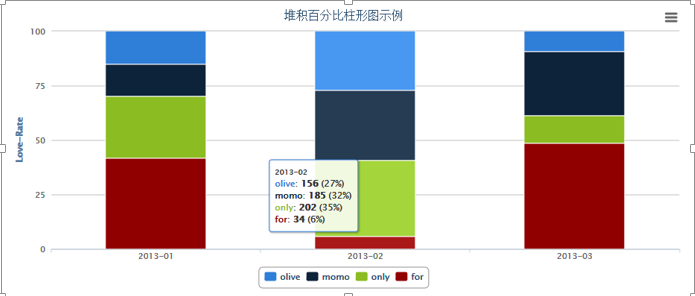
2.3.3 柱形图
l 页面引用
<script src="../Scripts/jquery-1.11.0.min.js" type="text/javascript"></script>

    <script src="../Statics/highcharts.js" type="text/javascript"></script>

    <script src="../Statics/exporting.js" type="text/javascript"></script>

    <script src="../Statics/HighChart.js" type="text/javascript"></script>

    <script type="text/javascript">

        $(function () {

            var data = [
            { name: '2013-01', group: 'olive', value: 116 },
            { name: '2013-01', group: 'momo', value: 115 },
            { name: '2013-01', group: 'only', value: 222 },
            { name: '2013-01', group: 'for', value: 324 },
            { name: '2013-02', group: 'olive', value: 156 },
            { name: '2013-02', group: 'momo', value: 185 },
            { name: '2013-02', group: 'only', value: 202 },
            { name: '2013-02', group: 'for', value: 34 },
            { name: '2013-03', group: 'olive', value: 16 },
            { name: '2013-03', group: 'momo', value: 51 },
            { name: '2013-03', group: 'only', value: 22 },
            { name: '2013-03', group: 'for', value: 84 }
            ];
            var opt = HighChart.ChartOptionTemplates.Bars(data, '','','Love-Rate', "分组柱形图示例");
            var container = $("#container");
            HighChart.RenderChart(opt, container);
            var opt1 = HighChart.ChartOptionTemplates.Bars(data, true,'','Love-Rate', "堆积柱形图示例");
            var container1 = $("#container1");
            HighChart.RenderChart(opt1, container1);
            var opt2 = HighChart.ChartOptionTemplates.Bars(data, '',true ,'Love-Rate', "堆积百分比柱形图示例");
            var container2 = $("#container2");
            HighChart.RenderChart(opt2, container2);
        });
    </script>
l 展示效果
分组柱形图

堆积图
堆积百分比图
后记:
这里只是列出了常用的一些图表类型,如果有特殊需要的话还可以进行自主的去抽象扩展。后续有时间的话,我也会对新的图表类型进行扩展,还有,关于HighChart里边的数据下钻的功能,这里也没有列出来,个人觉得这种图表的交互,抽象出来意义不是很大,后续再看看吧,有时间的话就再试着弄弄。