









import pandas as pd

data = pd.read_csv("input/abalone_dataset.csv")

print(data.shape)

#绘图中文字体
import matplotlib as mpl
mpl.rcParams['font.sans-serif']=['SimHei']  # #指定默认字体 SimHei为黑体
mpl.rcParams['axes.unicode_minus']=False  # #用来正常显示负号

import matplotlib.pyplot as plt
data["sex"].value_counts().sort_index().plot(kind="bar",title='sex')
plt.show()

#鲍鱼数据预处理
sex_onehot = pd.get_dummies(data["sex"], prefix="sex")
# sex_onehot.info()
#参数axis=0表示上下合并,1表示左右合并,ignore_index=True表示忽略原来的索引
data_new = pd.concat([data,sex_onehot],axis=1,ignore_index=False)
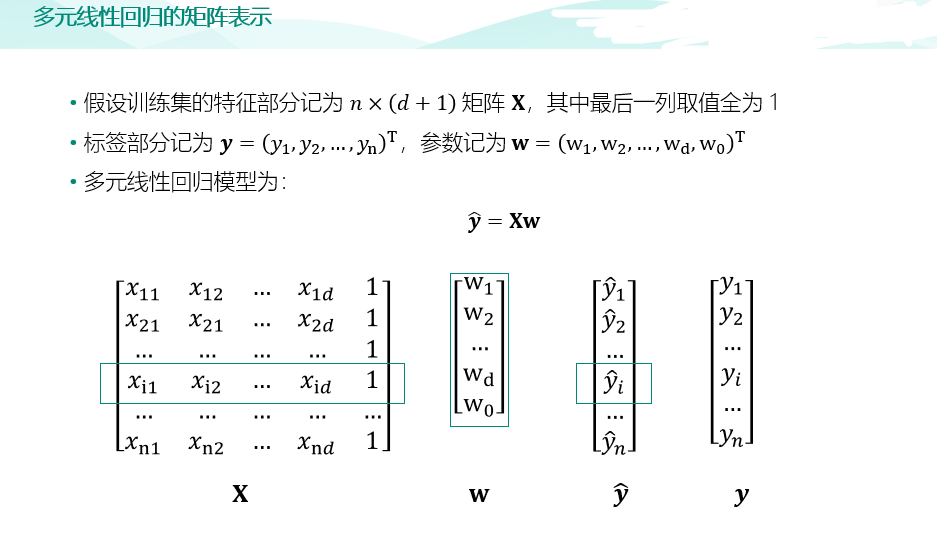
data_new["ones"] = 1

#环数 rings 加上 1.5 得到年龄
data_new['age']=data_new['rings']+1.5
# print(data_new)

#构造两组特征集
y = data_new["age"]
features_with_ones = ["length","diameter","height","whole_weight","shucked_weight","viscera_weight","shell_weight","sex_F","sex_M","ones"]
features_without_ones=["length","diameter","height","whole_weight","shucked_weight","viscera_weight","shell_weight","sex_F","sex_M"]
x = data_new[features_with_ones]
print(x)

from sklearn import model_selection
x_train,x_test,y_train,y_test = model_selection.train_test_split(x,y,test_size=0.2, random_state=111)

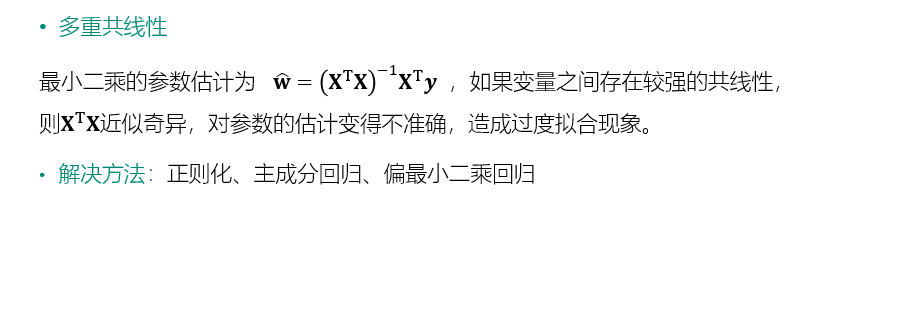
from sklearn import linear_model
lr = linear_model.LinearRegression()
lr.fit(x_train[features_without_ones],y_train)

from sklearn import linear_model
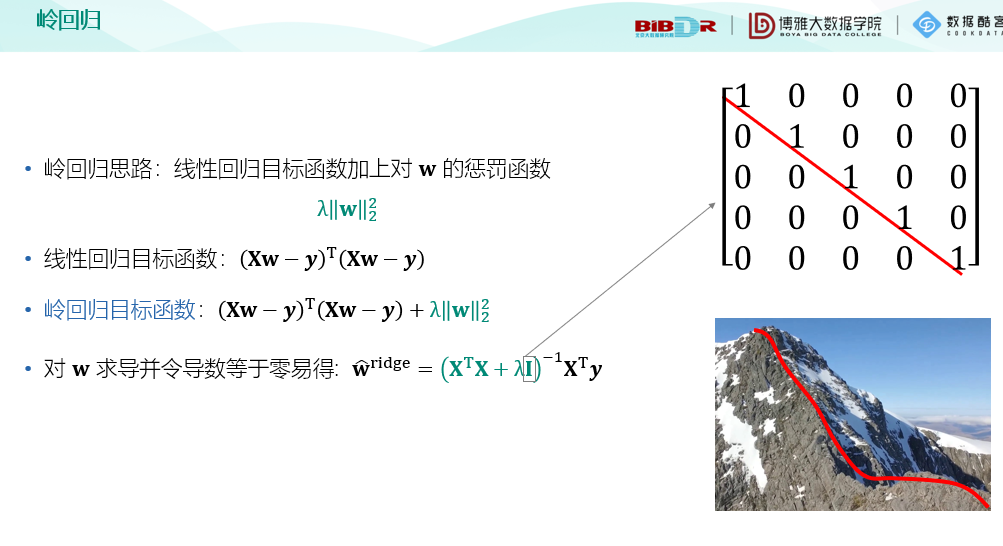
ridge = linear_model.Ridge(alpha=1.0)
ridge.fit(x_train[features_without_ones],y_train)

from sklearn import linear_model
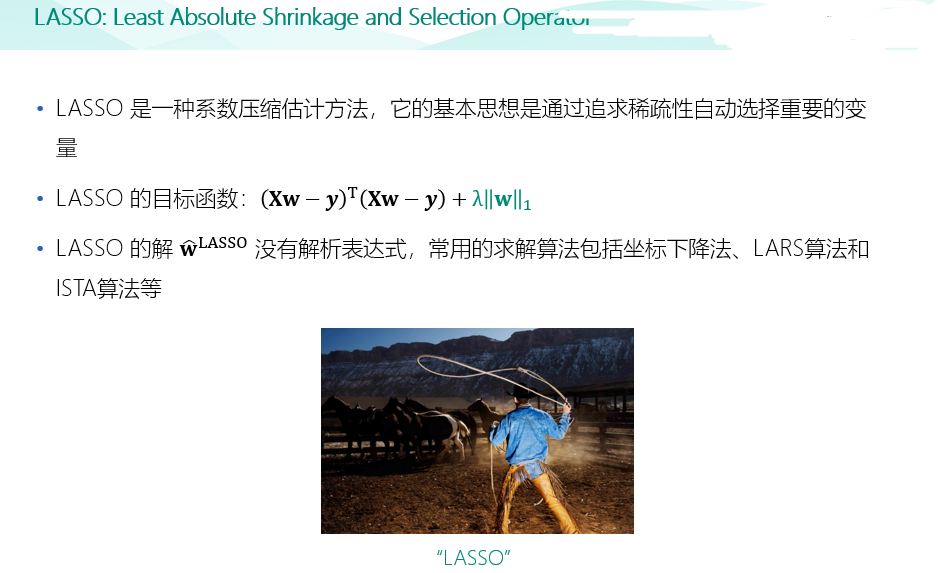
lasso = linear_model.Lasso(alpha=0.01)
lasso.fit(x_train[features_without_ones],y_train)

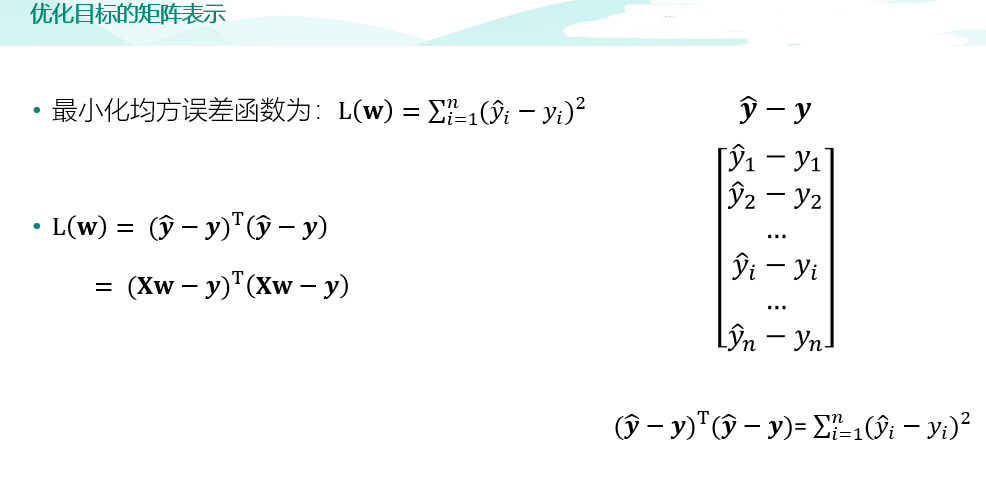
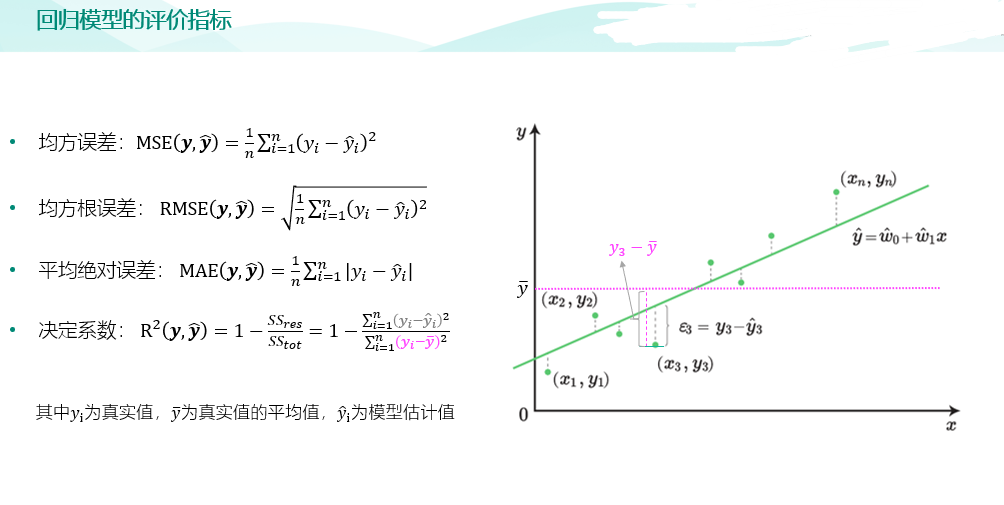
#均方误差和决定系数 R^2
from sklearn.metrics import mean_absolute_error
y_test_pred_lr = lr.predict(x_test.iloc[:,:-1])
print(round(mean_absolute_error(y_test,y_test_pred_lr),4))

y_test_pred_ridge = ridge.predict(x_test[features_without_ones])
print(round(mean_absolute_error(y_test,y_test_pred_ridge),4))

y_test_pred_lasso = lasso.predict(x_test[features_without_ones])
print(round(mean_absolute_error(y_test,y_test_pred_lasso),4))

from sklearn.metrics import r2_score
print(round(r2_score(y_test,y_test_pred_lr),4))
print(round(r2_score(y_test,y_test_pred_ridge),4))
print(round(r2_score(y_test,y_test_pred_lasso),4))

#残差图是一种用来诊断回归模型效果的图。在残差图中,如果点随机分布在 0 附近,则说明回归效果较好。
# 如果在残差图中发现了某种结构,则说明回归效果不佳,需要重新建模。
plt.figure(figsize=(9, 6))
y_train_pred_ridge = ridge.predict(x_train[features_without_ones])
plt.scatter(y_train_pred_ridge, y_train_pred_ridge - y_train, c="g", alpha=0.6)
plt.scatter(y_test_pred_ridge, y_test_pred_ridge - y_test, c="r",alpha=0.6)
plt.hlines(y=0, xmin=0, xmax=30,color="b",alpha=0.6)
plt.ylabel("Residuals")
plt.xlabel("Predict")
plt.show()

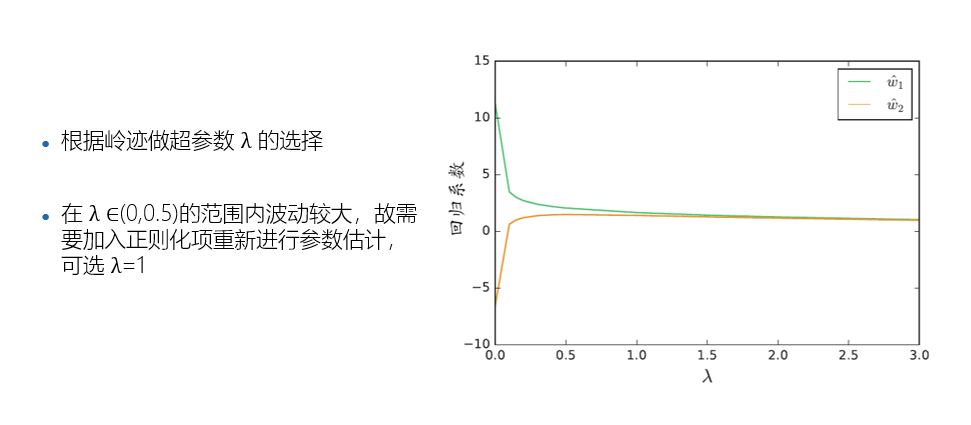
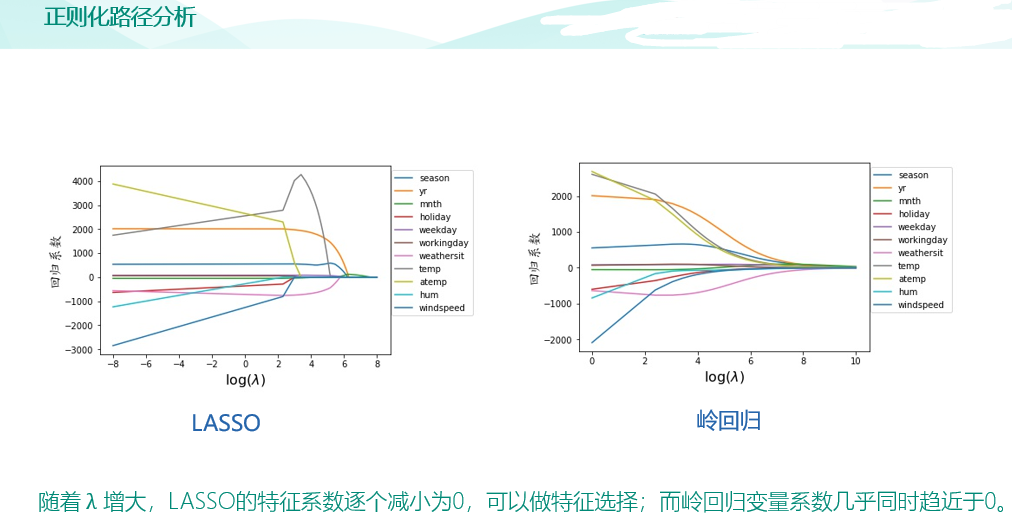
#岭迹
import numpy as np
alphas = np.logspace(-10,10,20)
coef = pd.DataFrame()
for alpha in alphas:
    ridge_clf = linear_model.Ridge(alpha=alpha)
    ridge_clf.fit(x_train[features_without_ones],y_train)
    df = pd.DataFrame([ridge_clf.coef_],columns=x_train[features_without_ones].columns)
    df['alpha'] = alpha
    coef = coef.append(df,ignore_index=True)
coef.head().round(decimals=2)
#绘图
plt.rcParams['figure.dpi'] = 300 #分辨率
plt.figure(figsize=(9, 6))
coef['alpha'] = coef['alpha']

for feature in x_train.columns[:-1]:
    plt.plot('alpha',feature,data=coef)
ax = plt.gca()
ax.set_xscale('log')
plt.legend(loc='upper right')
plt.xlabel(r'$alpha$',fontsize=15)
plt.ylabel('系数',fontsize=15)

plt.show()

#LASSO 的正则化路径
coef = pd.DataFrame()
for alpha in np.linspace(0.0001,0.2,20):
    lasso_clf = linear_model.Lasso(alpha=alpha)
    lasso_clf.fit(x_train[features_without_ones],y_train)
    df = pd.DataFrame([lasso_clf.coef_],columns=x_train[features_without_ones].columns)
    df['alpha'] = alpha
    coef = coef.append(df,ignore_index=True)
coef.head()
#绘图
plt.figure(figsize=(9, 6))
for feature in x_train.columns[:-1]:
    plt.plot('alpha',feature,data=coef)
plt.legend(loc='upper right')
plt.xlabel(r'$alpha$',fontsize=15)
plt.ylabel('系数',fontsize=15)
plt.show()