后台 py 代码 app.py
'''
服务器cpu监控程序

思路:后端后台线程一旦产生数据,即刻推送至前端。
好处:不需要前端ajax定时查询,节省服务器资源。

作者:hhh5460
时间:2017.8.19
'''
import psutil
import time

from threading import Lock

from flask import Flask, render_template, session, request
from flask_socketio import SocketIO, emit

# Set this variable to "threading", "eventlet" or "gevent" to test the
# different async modes, or leave it set to None for the application to choose
# the best option based on installed packages.
async_mode = None

app = Flask(__name__)
app.config['SECRET_KEY'] = 'secret!'
socketio = SocketIO(app, async_mode=async_mode)


thread = None
thread_lock = Lock()


# 后台线程 产生数据,即刻推送至前端
def background_thread():
    """Example of how to send server generated events to clients."""
    count = 0
    while True:
        socketio.sleep(5)
        count += 1
        t = time.strftime('%M:%S', time.localtime()) # 获取系统时间(只取分:秒)
        cpus = psutil.cpu_percent(interval=None, percpu=True) # 获取系统cpu使用率 non-blocking
        socketio.emit('server_response',
                      {'data': [t, *cpus], 'count': count},
                      namespace='/test') # 注意:这里不需要客户端连接的上下文,默认 broadcast = True !!!!!!!


@app.route('/')
def index():
    return render_template('index.html', async_mode=socketio.async_mode)


# 与前端建立 socket 连接后,启动后台线程
@socketio.on('connect', namespace='/test')
def test_connect():
    global thread
    with thread_lock:
        if thread is None:
            thread = socketio.start_background_task(target=background_thread)


if __name__ == '__main__':
    socketio.run(app, debug=True)
前端页面 /template/index.html
<!DOCTYPE html>
<html lang="en">
<head>
    <meta charset="utf-8">
    <title>ECharts3 Ajax</title>
    <script type="text/javascript" src="//cdn.bootcss.com/jquery/3.1.1/jquery.min.js"></script>
    <script type="text/javascript" src="//cdn.bootcss.com/socket.io/1.5.1/socket.io.min.js"></script>
    <!-- ECharts 3 引入 -->
    <script src="http://echarts.baidu.com/dist/echarts.min.js"></script>
</head>

<body>
    <!--为ECharts准备一个具备大小(宽高)的Dom-->
    <div id="main" style="height:500px;border:1px solid #ccc;padding:10px;"></div>

    <script type="text/javascript">
    // 作者:hhh5460
    // 时间:2017.8.19
    //--- 折柱 ---
    var myChart = echarts.init(document.getElementById('main'));

    myChart.setOption({
        title: {
            text: '服务器系统监控'
        },
        tooltip: {},
        legend: {
            data:['cpu1','cpu2','cpu3','cpu4']
        },
        xAxis: {
            data: []
        },
        yAxis: {},
        series: [{
            name: 'cpu1',
            type: 'line',
            data: []
        },{
            name: 'cpu2',
            type: 'line',
            data: []
        },{
            name: 'cpu3',
            type: 'line',
            data: []
        },{
            name: 'cpu4',
            type: 'line',
            data: []
        }]
    });

    // 本人笔记本有四个cpu,读者朋友请根据自己的情况,相应修改!!
    // 五个全局变量:time、cpu1、cpu2、cpu3、cpu4
    var time = ["","","","","","","","","",""],
        cpu1 = [0,0,0,0,0,0,0,0,0,0],
        cpu2 = [0,0,0,0,0,0,0,0,0,0],
        cpu3 = [0,0,0,0,0,0,0,0,0,0],
        cpu4 = [0,0,0,0,0,0,0,0,0,0]


    //准备好统一的 callback 函数
    var update_mychart = function (res) { //res是json格式的response对象

        // 隐藏加载动画
        myChart.hideLoading();

        // 准备数据
        time.push(res.data[0]);
        cpu1.push(parseFloat(res.data[1]));
        cpu2.push(parseFloat(res.data[2]));
        cpu3.push(parseFloat(res.data[3]));
        cpu4.push(parseFloat(res.data[4]));
        if (time.length >= 10){
            time.shift();
            cpu1.shift();
            cpu2.shift();
            cpu3.shift();
            cpu4.shift();
        }

        // 填入数据
        myChart.setOption({
            xAxis: {
                data: time
            },
            series: [{
                name: 'cpu1', // 根据名字对应到相应的系列
                data: cpu1
            },{
                name: 'cpu2',
                data: cpu2
            },{
                name: 'cpu3',
                data: cpu3
            },{
                name: 'cpu4',
                data: cpu4
            }]
        });

    };

    // 首次显示加载动画
    myChart.showLoading();


    // 建立socket连接,等待服务器“推送”数据,用回调函数更新图表
    $(document).ready(function() {
        namespace = '/test';
        var socket = io.connect(location.protocol + '//' + document.domain + ':' + location.port + namespace);

        socket.on('server_response', function(res) {
            update_mychart(res);
        });

    });

    </script>
</body>
</html>
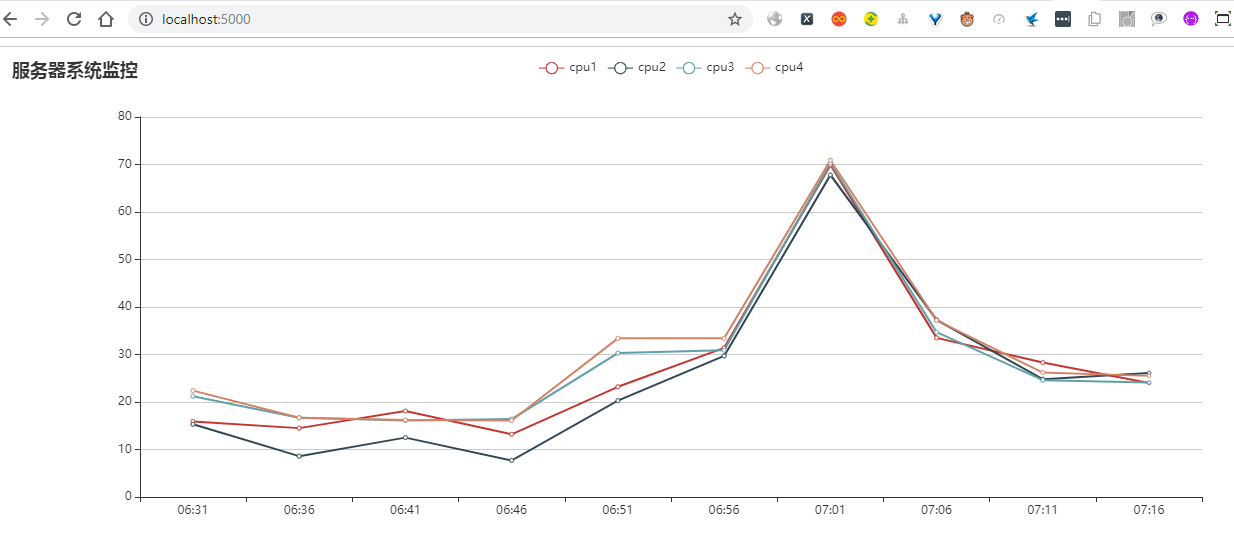
效果图

