一、系统搭建(以Centos7为例)
因为我们的主要目的是展示zabbix的数据,所以建议大家直接在zabbix的服务器上搭建这个系统,亲测两系统无冲突,这样部署的好处是两系统间的数据传输更快,前端展示加载速度也将更快。
首先简单粗暴点,关闭防火墙,以免系统启动的时候出问题。
关闭防火墙
[root@localhost ~]# systemctl stop firewalld.service
关闭防火墙的开机自启
  [root@localhost ~]# systemctl disable firewalld.service
  Removed symlink /etc/systemd/system/dbus-org.fedoraproject.FirewallD1.service.
  Removed symlink /etc/systemd/system/basic.target.wants/firewalld.service.
替换防火墙参数
[root@localhost ~]# sed -i 's/SELINUX=enforcing/SELINUX=disabled/' /etc/selinux/config
查看防火墙状态
  [root@localhost ~]# grep SELINUX=disabled /etc/selinux/config
  SELINUX=disabled
关闭当前防火墙
[root@localhost ~]# setenforce 0
下载rpm源并安装
wget https://dl.grafana.com/oss/release/grafana-5.4.2-1.x86_64.rpm
yum localinstall grafana-5.4.2-1.x86_64.rpm -y
安装插件(这里以zabbix插件为例,其他插件可以去上面的插件库链接里看,需要的再安装)
grafana-cli plugins install alexanderzobnin-zabbix-app
也可以查看grafana-zabbix-app 库,安装最新的插件:
cd /var/lib/grafana/plugins
git clone https://github.com/alexanderzobnin/grafana-zabbix-app
然后重启grafana
最后启动Grafana并添加开机启动项即可。
systemctl start grafana-server
systemctl enable grafana-server
二、对接zabbix系统
首先打开grafana页面,地址为:你的grafana服务器ip地址+3000端口(比如192.168.0.2:3000),然后我们就可以看到如下登录界面:
1、默认帐号密码均为admin

2、修改密码(可选)

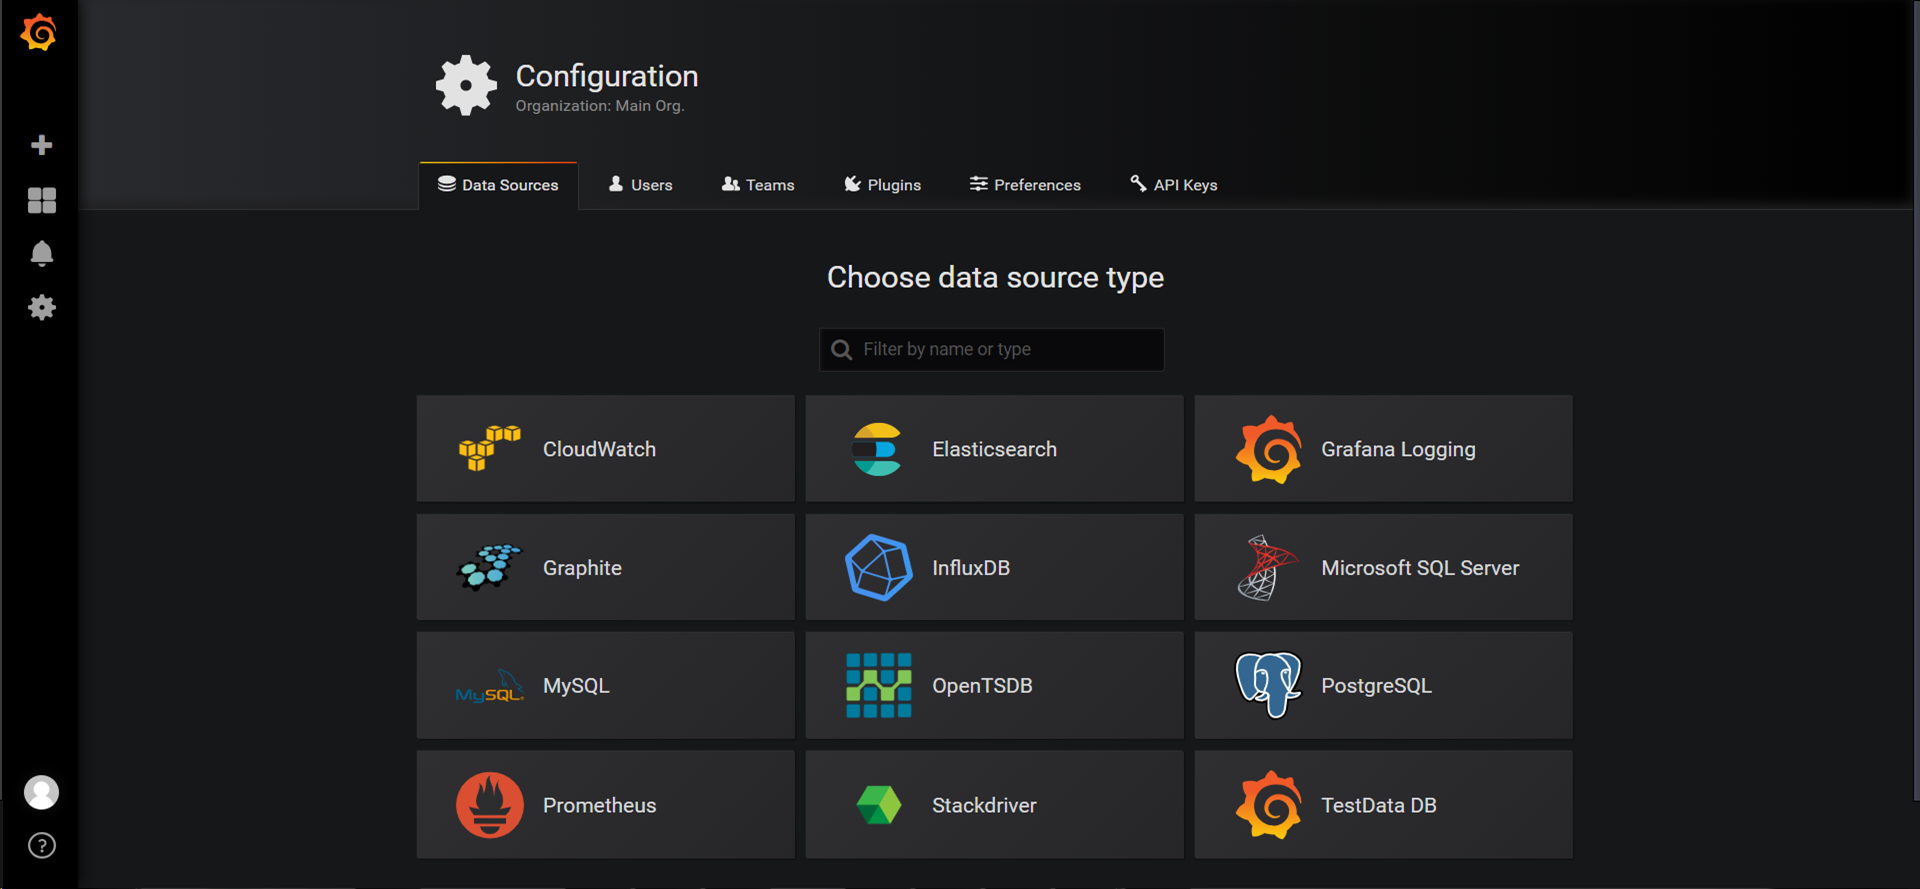
3、然后我们开始配置数据源,点击add data source绿色按钮:
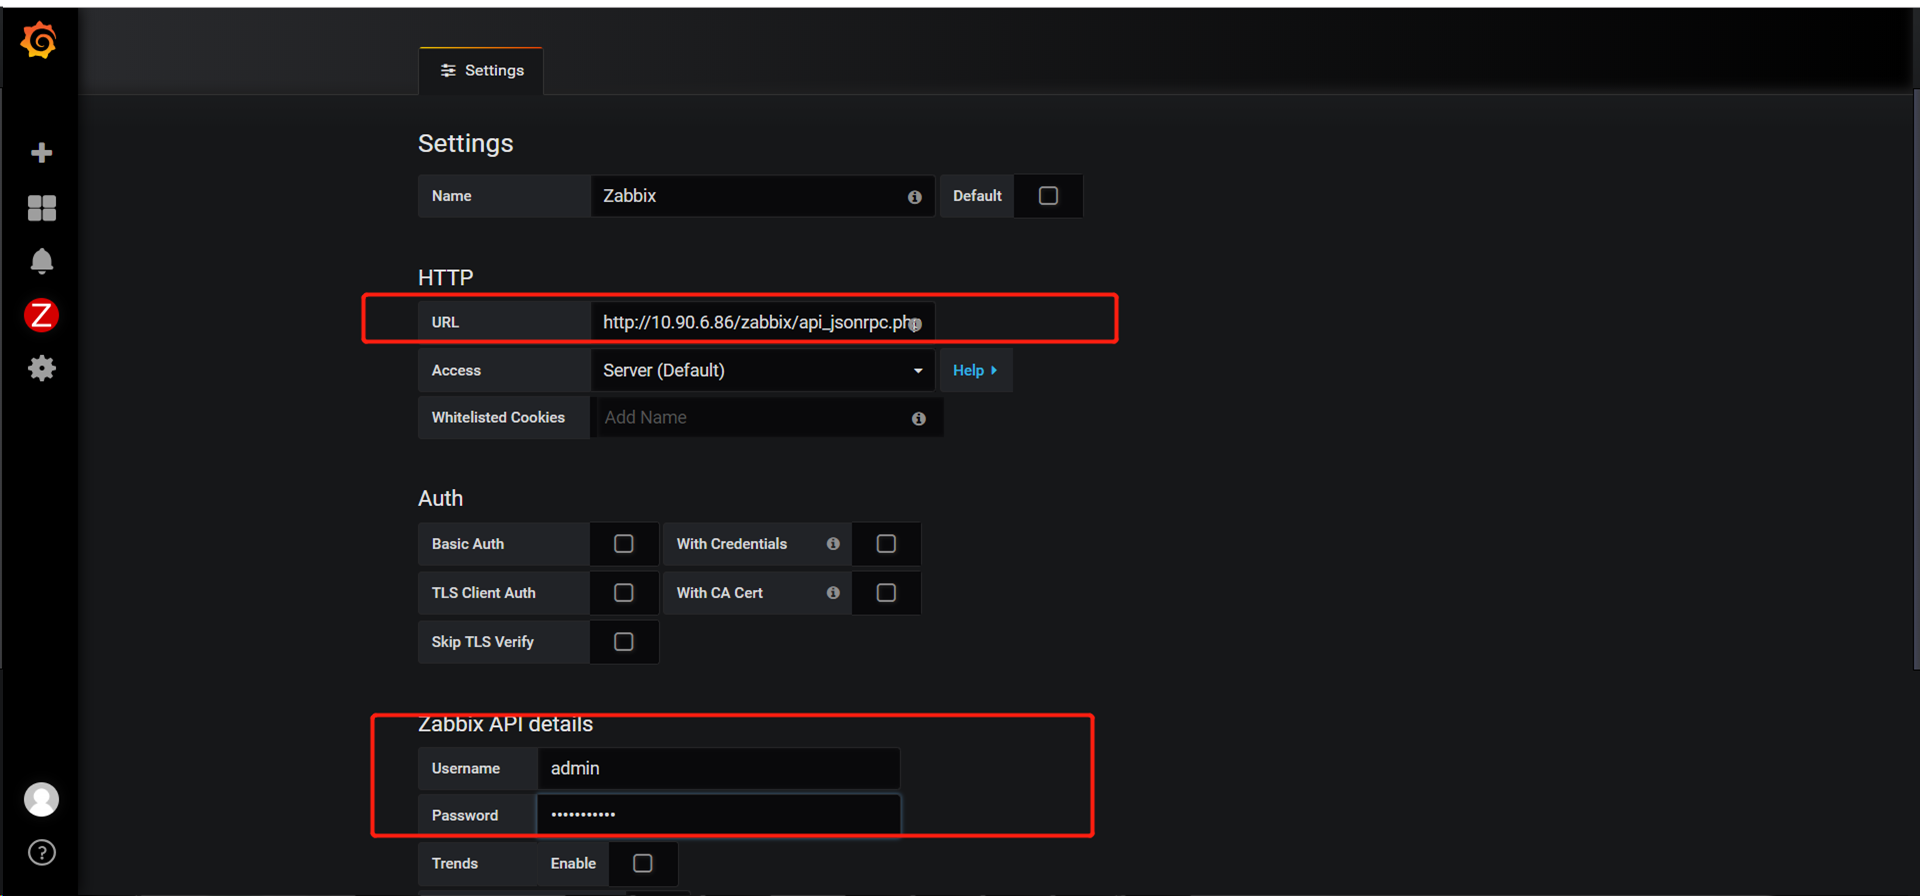
4、数据源链接配置:http://10.90.6.86/zabbix/api_jsonrpc.php
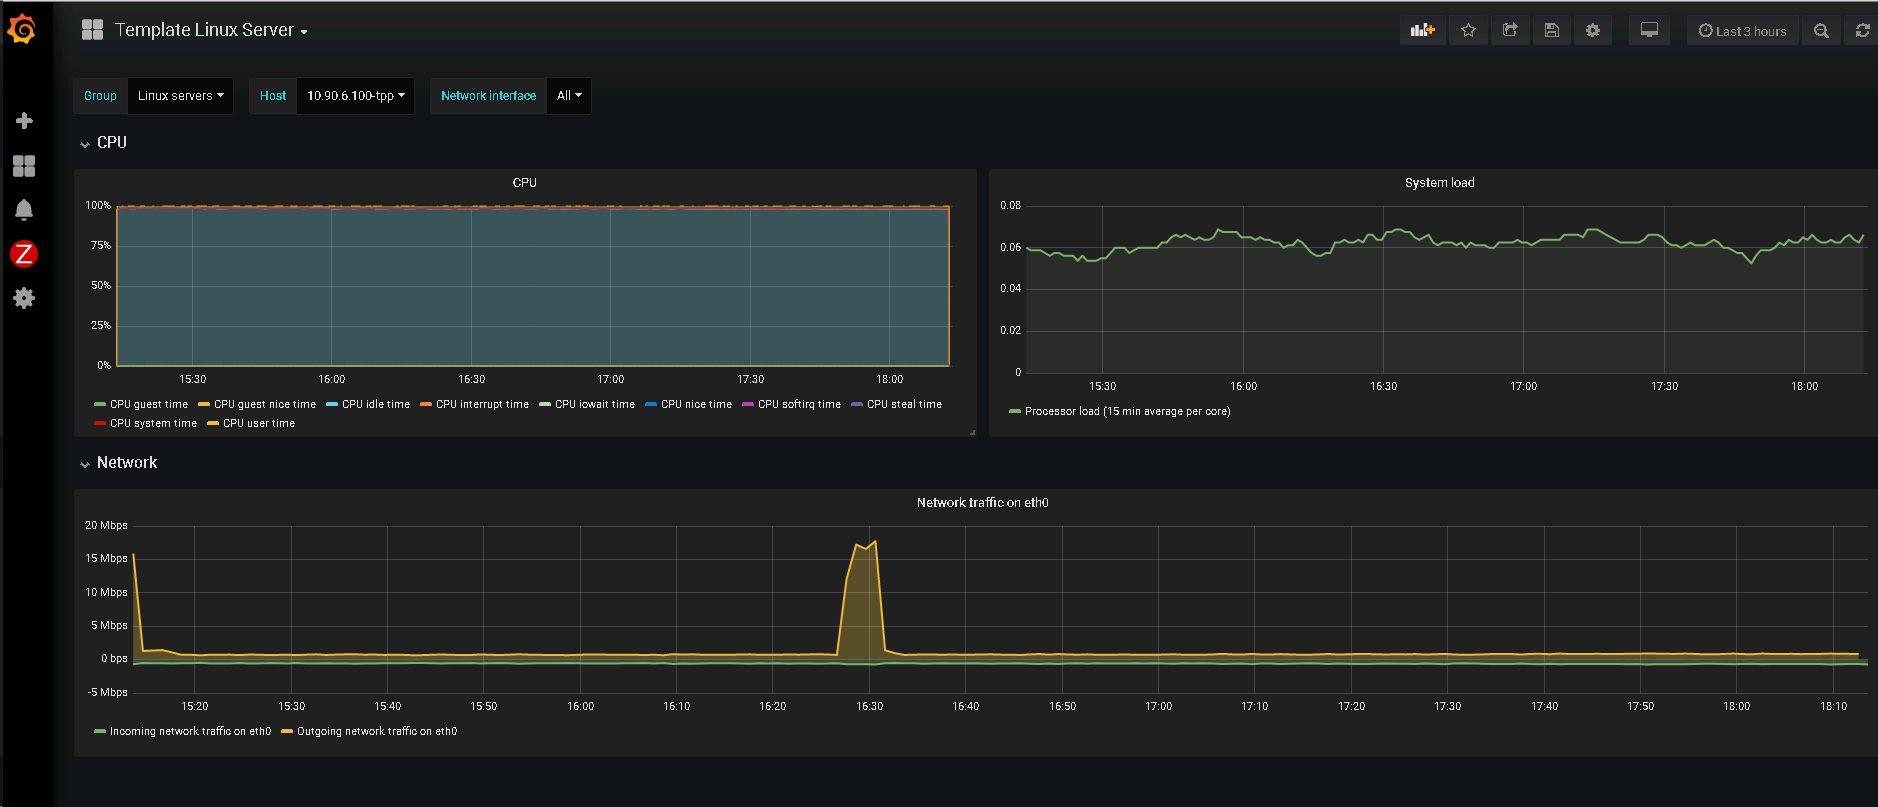
5、结果