Geomesa(一)基础介绍、定位:https://blog.csdn.net/abc553226713/article/details/108527898
geospark geotrellis geomesa geowave的异同:https://www.zhihu.com/question/357231642
1. Introduction简介
1.1. What is GeoMesa?什么是GeoMesa?
GeoMesa is an Apache-licensed, open-source suite of tools that enables large-scale geospatial analytics on distributed computing systems, letting you manage and analyze the huge spatio-temporal datasets that IoT, social media, tracking, and mobile phone applications seek to take advantage of today.
GeoMesa是一套获得Apache许可的开源工具,可在分布式计算系统上实现大规模地理空间分析,让您管理和分析物联网、社交媒体、跟踪和移动电话应用程序如今试图利用的巨大时空数据集。
GeoMesa does this by providing spatio-temporal data persistence on top of popular distributed databases for massive storage of point, line, and polygon data. It allows rapid access to this data via queries that take full advantage of geographical properties to specify distance and area. GeoMesa also provides support for near real time stream processing of spatio-temporal data by layering spatial semantics on top of the Apache Kafka messaging system.
GeoMesa通过在流行的分布式数据库上提供时空数据持久性来实现这一点,以大规模存储点、线和多边形数据。它允许通过充分利用地理属性指定距离和面积的查询快速访问这些数据。GeoMesa还通过在Apache Kafka消息传递系统上分层空间语义,为时空数据的近实时流处理提供支持。
Through a geographical information server such as GeoServer, GeoMesa facilitates integration with a wide range of existing mapping clients by enabling access to its databases and streaming capabilities over standard OGC (Open Geospatial Consortium) APIs and protocols such as WFS and WMS. These interfaces also let GeoMesa drive map user interfaces and serve up data for analytics such as queries, histograms, heat maps, and time series analyses.
GeoMesa通过GeoServer等地理信息服务器,通过标准OGC(开放地理空间联盟)API和WFS和WMS等协议访问其数据库和流媒体功能,促进了与各种现有地图客户端的集成。这些接口还允许GeoMesa驱动地图用户界面,并为查询、直方图、热图和时间序列分析等分析提供数据。
GeoMesa features include the ability to:
GeoMesa的功能包括:
- Store gigabytes to petabytes of spatial data (tens of billions of points or more)存储千兆字节到千兆字节的空间数据(数百亿点或更多)
- Serve up tens of millions of points in seconds在几秒钟内完成数千万分的发球
- Ingest data faster than 10,000 records per second per node每个节点每秒接收数据的速度超过10000条记录
- Scale horizontally easily (add more servers to add more capacity)易于横向扩展(添加更多服务器以增加容量)
- Support Spark analytics 支持Spark analytics
- Drive a map through GeoServer or other OGC Clients 通过GeoServer或其他OGC客户端驱动地图
There are many reasons that GeoMesa can provide the best solution to your spatio-temporal database needs:
GeoMesa能够为您的时空数据库需求提供最佳解决方案的原因有很多:
- You have Big Spatial Data sets and are reaching performance limitations of relational database systems. Perhaps you are looking at sharding strategies and wondering if now is the time to look for a new storage solution.您拥有大的空间数据集,并且正达到关系数据库系统的性能限制。也许您正在研究切分策略,并想知道现在是否是寻找新存储解决方案的时候。
- You have very high-velocity data and need high read and write speeds.你有很高的数据速度,需要很高的读写速度。
- Your analytics operate in the cloud, perhaps using Spark, and you want to enable spatial analytics.您的分析在云端运行,可能使用Spark,您希望启用空间分析。
- You are looking for a supported, open-source alternative to expensive proprietary solutions.您正在寻找一种受支持的开源替代方案,以替代昂贵的专有解决方案。
- You are looking for a Platform as a Service (PaaS) database where you can store Big Spatial Data.您正在寻找一个平台即服务(PaaS)数据库,可以在其中存储大型空间数据。
- You want to filter data using the rich Common Query Language (CQL) defined by the OGC.您希望使用OGC定义的丰富公共查询语言(CQL)过滤数据
Not sure where to begin? Take a look at Getting Started.
1.2. Community and Support
The main GeoMesa website is http://www.geomesa.org/. For additional information, see:
- Getting started tutorials
- The GeoMesa users and developers mailing list archives
- The community chat on Gitter.

GeoMesa is a member of the LocationTech working group of the Eclipse Foundation.
1.3. License
GeoMesa is open-source software, and is licensed under the Apache License Version 2.0: http://apache.org/licenses/LICENSE-2.0.html
3. Installation安装
Installation instructions are available for each data store implementation:
每个数据存储实现都有安装说明:
- Installing GeoMesa HBase
- Installing GeoMesa Accumulo
- Installing GeoMesa Cassandra
- Installing GeoMesa Bigtable
- Installing GeoMesa Kafka
- Installing GeoMesa Redis
- Installing GeoMesa FileSystem
- Installing GeoMesa Kudu
Not sure where to begin? Take a look at Getting Started.
不确定从哪开始?看一下Getting Started(上手指南)。
4. Getting Started上手指南
The first step to getting started with GeoMesa is to choose a persistent storage solution. This may be dictated by your target environment, but if not there are several options available.
开始使用GeoMesa的第一步是选择持久存储解决方案。这可能取决于您的目标环境,但如果没有的话,有几个选项可用。
If you want a near real-time view of streaming data, then consider using Kafka or Redis.
如果你想要一个实时的流数据实时视图,那么考虑使用Kafka或Redis。
Otherwise, you can get similar functionality through HBase, Accumulo, Cassandra, Google Bigtable or Apache Kudu. HBase and Accumulo support distributed processing, so may be faster for certain operations. HBase and Cassandra are the most widely-used technologies, while Accumulo is often chosen for its advanced security features.
否则,您可以通过HBase、Accumulo、Cassandra、Google Bigtable或Apache Kudu获得类似的功能。HBase和Accumulo支持分布式处理,因此某些操作可能会更快。HBase和Cassandra是应用最广泛的技术,而Accumulo则常常会因其先进的安全功能而被选中。
Another option is the FileSystem data store, which has a very low barrier to entry, and can read existing data in a variety of file formats. The FileSystem data store can provide extremely low-cost storage when backed by cloud-native object stores; however, it generally is not as performant as using an actual database.
另一个选项是文件系统数据存储,它的进入门槛非常低,可以读取各种文件格式的现有数据。在云本地对象存储的支持下,文件系统数据存储可以提供极低成本的存储;然而,它的性能通常不如使用实际的数据库。
For advanced use cases, multiple stores can be combined through Combined Data Store Views to provide both high performance (for recent data) and low cost (for older data).
对于高级用例,可以通过组合的数据存储视图组合多个存储,以提供高性能(对于最近的数据)和低成本(对于较旧的数据)。
Whichever storage solution you choose, the GeoMesa API is the same (outside of some back-end-specific configuration options). For most users, the back-end can be swapped out with minimal code changes.
无论您选择哪种存储解决方案,GeoMesa API都是相同的(除了一些特定于后端的配置选项)。对于大多数用户来说,只需对代码进行最小的更改即可调出后端。
4.1. Quick Starts快速启动
The GeoMesa quick start tutorials are the fastest and easiest way to get started with GeoMesa. They are a good stepping-stone on the path to the other tutorials that present increasingly involved examples of how to use GeoMesa. The tutorials show how to write custom Java code to ingest and query data with GeoMesa, and visualize the changes being made in GeoServer.
GeoMesa快速入门教程是学习GeoMesa最快、最简单的方法。它们是通往其他教程的一个很好的踏脚石,这些教程提供了越来越多有关如何使用GeoMesa的示例。这些教程展示了如何编写自定义Java代码,以便使用GeoMesa接收和查询数据,并可视化在GeomeServer中所做的更改。
4.2. Data Ingestion
GeoMesa provides an ingestion framework that can be configured using JSON, which means that your data can be ingested without writing any code. This makes it quick and easy to get started with your custom data formats, and updates can be handled on-the-fly, without code changes.
4.3. GeoJSON
GeoMesa provides built-in integration with GeoJSON. GeoMesa provides a GeoJSON API that allows for the indexing and querying of GeoJSON data without using the GeoTools API – all data and operations are pure JSON. The API also includes a REST endpoint for web integration.
4.4. Spark
GeoMesa provides spatial functionality on top of Spark and Spark SQL. To get started, see Data Analysis.
二、GeoMesa + HBase Quick Start
This tutorial is the fastest and easiest way to get started with GeoMesa using HBase. It is a good stepping-stone on the path to the other tutorials, that present increasingly involved examples of how to use GeoMesa.
About this Tutorial
In the spirit of keeping things simple, the code in this tutorial only does a few small things:
- Establishes a new (static) SimpleFeatureType
- Prepares the HBase tables to store this type of data
- Creates a few thousand example SimpleFeatures
- Writes these SimpleFeatures to HBase
- Queries for a given geographic rectangle, time range, and attribute filter, writing out the entries in the result set
- Uses GeoServer to visualize the data (optional)
Prerequisites
Before you begin, you must have the following installed and configured:
- Java JDK 1.8
- Apache Maven 3.5.2 or later
- a GitHub client
- an HBase 1.4.x or 2.2.x instance
- the GeoMesa HBase distributed runtime installed for your HBase instance (see below)
If you do not have an existing HBase instance, you can easily set one up as detailed next.
Setting up HBase in standalone mode (optional)
(Skip this section if you have an existing HBase 1.4.x or 2.2.x installation.)
Download the HBase 1.4.13 binary distribution from https://hbase.apache.org/downloads.html
Follow the chapter in the HBase Manual for running a standalone instance of HBase (https://hbase.apache.org/book.html#quickstart). Note that this will use the local filesystem instead of HDFS, and will spin up its own instances of HBase and Zookeeper.
Installing the GeoMesa Distributed Runtime
Follow the instructions under Installing the GeoMesa Distributed Runtime JAR and Register the Coprocessors to install GeoMesa in your HBase instance.
Download and Build the Tutorial
Pick a reasonable directory on your machine, and run:
$ git clone https://github.com/geomesa/geomesa-tutorials.git
$ cd geomesa-tutorials
Warning
Make sure that you download or checkout the version of the tutorials project that corresponds to your GeoMesa version. See About Tutorial Versions for more details.
To ensure that the quick start works with your environment, modify the pom.xml to set the appropriate versions for HBase, Hadoop, etc.
For ease of use, the project builds a bundled artifact that contains all the required dependencies in a single JAR. To build, run:
$ mvn clean install -pl geomesa-tutorials-hbase/geomesa-tutorials-hbase-quickstart -am
Running the Tutorial
On the command line, run:
$ java -cp geomesa-tutorials-hbase/geomesa-tutorials-hbase-quickstart/target/geomesa-tutorials-hbase-quickstart-$VERSION.jar \
    org.geomesa.example.hbase.HBaseQuickStart \
    --hbase.zookeepers <zookeepers>           \
    --hbase.catalog <table>
where you provide the following arguments:
<zookeepers>the HBase Zookeeper quorum. If you installed HBase in stand-alone mode, this will belocalhost. Note that for most use cases, it is preferable to put thehbase-site.xmlfrom your cluster on the GeoMesa classpath instead of specifying Zookeepers.<table>the name of the destination table that will accept these test records. This table should either not exist or should be empty
Optionally, you can also specify that the quick start should delete its data upon completion. Use the --cleanup flag when you run to enable this behavior.
Once run, you should see the following output:
Loading datastore

Creating schema: GLOBALEVENTID:String,Actor1Name:String,Actor1CountryCode:String,Actor2Name:String,Actor2CountryCode:String,EventCode:String,NumMentions:Integer,NumSources:Integer,NumArticles:Integer,ActionGeo_Type:Integer,ActionGeo_FullName:String,ActionGeo_CountryCode:String,dtg:Date,geom:Point:srid=4326

Generating test data

Writing test data
Wrote 2356 features

Running test queries
Running query BBOX(geom, -120.0,30.0,-75.0,55.0) AND dtg DURING 2017-12-31T00:00:00+00:00/2018-01-02T00:00:00+00:00
01 719027236=719027236|UNITED STATES|USA|INDUSTRY||012|1|1|1|3|Central Valley, California, United States|US|2018-01-01T00:00:00.000Z|POINT (-119.682 34.0186)
02 719027005=719027005|UNITED STATES|USA|||172|2|2|2|3|Long Beach, California, United States|US|2018-01-01T00:00:00.000Z|POINT (-118.189 33.767)
03 719026204=719026204|JUDGE||||0214|6|1|6|3|Los Angeles, California, United States|US|2018-01-01T00:00:00.000Z|POINT (-118.244 34.0522)
04 719025745=719025745|KING||||051|4|2|4|2|California, United States|US|2018-01-01T00:00:00.000Z|POINT (-119.746 36.17)
05 719026858=719026858|UNITED STATES|USA|||010|20|2|20|2|California, United States|US|2018-01-01T00:00:00.000Z|POINT (-119.746 36.17)
06 719026964=719026964|UNITED STATES|USA|||081|2|2|2|2|California, United States|US|2018-01-01T00:00:00.000Z|POINT (-119.746 36.17)
07 719026965=719026965|CALIFORNIA|USA|||081|8|1|8|2|California, United States|US|2018-01-01T00:00:00.000Z|POINT (-119.746 36.17)
08 719025635=719025635|PARIS|FRA|||010|2|1|2|3|Las Vegas, Nevada, United States|US|2018-01-01T00:00:00.000Z|POINT (-115.137 36.175)
09 719026918=719026918|UNITED STATES|USA|||042|20|5|20|3|Las Vegas, Nevada, United States|US|2018-01-01T00:00:00.000Z|POINT (-115.137 36.175)
10 719027141=719027141|ALABAMA|USA|JUDGE||172|8|1|8|2|Nevada, United States|US|2018-01-01T00:00:00.000Z|POINT (-117.122 38.4199)

Returned 669 total features

Running query BBOX(geom, -120.0,30.0,-75.0,55.0) AND dtg DURING 2017-12-31T00:00:00+00:00/2018-01-02T00:00:00+00:00
Returning attributes [GLOBALEVENTID, dtg, geom]
01 719027208=719027208|2018-01-01T00:00:00.000Z|POINT (-89.6812 32.7673)
02 719026313=719026313|2018-01-01T00:00:00.000Z|POINT (-84.388 33.749)
03 719026419=719026419|2018-01-01T00:00:00.000Z|POINT (-84.388 33.749)
04 719026316=719026316|2018-01-01T00:00:00.000Z|POINT (-83.6487 32.9866)
05 719027132=719027132|2018-01-01T00:00:00.000Z|POINT (-81.2793 33.4968)
06 719026819=719026819|2018-01-01T00:00:00.000Z|POINT (-81.9296 33.7896)
07 719026952=719026952|2018-01-01T00:00:00.000Z|POINT (-81.9296 33.7896)
08 719026881=719026881|2018-01-01T00:00:00.000Z|POINT (-82.0193 34.146)
09 719026909=719026909|2018-01-01T00:00:00.000Z|POINT (-82.0193 34.146)
10 719026951=719026951|2018-01-01T00:00:00.000Z|POINT (-82.0193 34.146)

Returned 669 total features

Running query EventCode = '051'
01 719024909=719024909|||MELBOURNE|AUS|051|10|1|10|4|Melbourne, Victoria, Australia|AS|2018-01-01T00:00:00.000Z|POINT (144.967 -37.8167)
02 719025178=719025178|AUSTRALIA|AUS|COMMUNITY||051|20|2|20|4|Sydney, New South Wales, Australia|AS|2018-01-01T00:00:00.000Z|POINT (151.217 -33.8833)
03 719025965=719025965|MIDWIFE||||051|10|1|10|4|Sydney, New South Wales, Australia|AS|2018-01-01T00:00:00.000Z|POINT (151.217 -33.8833)
04 719025509=719025509|COMMUNITY||AUSTRALIA|AUS|051|2|1|2|1|Australia|AS|2018-01-01T00:00:00.000Z|POINT (135 -25)
05 719025742=719025742|KING||||051|22|3|22|3|San Diego, California, United States|US|2018-01-01T00:00:00.000Z|POINT (-117.157 32.7153)
06 719025745=719025745|KING||||051|4|2|4|2|California, United States|US|2018-01-01T00:00:00.000Z|POINT (-119.746 36.17)
07 719025743=719025743|AUTHORITIES||||051|60|12|60|3|Wichita, Kansas, United States|US|2018-01-01T00:00:00.000Z|POINT (-97.3375 37.6922)
08 719027205=719027205|UNITED STATES|USA|SIOUX||051|4|1|4|3|Sioux City, Iowa, United States|US|2018-01-01T00:00:00.000Z|POINT (-96.4003 42.5)
09 719025111=719025111|||UNITED STATES|USA|051|2|1|2|3|Pickens County, South Carolina, United States|US|2018-01-01T00:00:00.000Z|POINT (-82.7165 34.9168)
10 719026938=719026938|PITTSBURGH|USA|||051|5|1|5|3|York County, Pennsylvania, United States|US|2018-01-01T00:00:00.000Z|POINT (-77 40.1254)

Returned 138 total features

Running query EventCode = '051' AND dtg DURING 2017-12-31T00:00:00+00:00/2018-01-02T00:00:00+00:00
Returning attributes [GLOBALEVENTID, dtg, geom]
01 719024909=719024909|2018-01-01T00:00:00.000Z|POINT (144.967 -37.8167)
02 719025178=719025178|2018-01-01T00:00:00.000Z|POINT (151.217 -33.8833)
03 719025965=719025965|2018-01-01T00:00:00.000Z|POINT (151.217 -33.8833)
04 719025509=719025509|2018-01-01T00:00:00.000Z|POINT (135 -25)
05 719025742=719025742|2018-01-01T00:00:00.000Z|POINT (-117.157 32.7153)
06 719025745=719025745|2018-01-01T00:00:00.000Z|POINT (-119.746 36.17)
07 719025743=719025743|2018-01-01T00:00:00.000Z|POINT (-97.3375 37.6922)
08 719027205=719027205|2018-01-01T00:00:00.000Z|POINT (-96.4003 42.5)
09 719025111=719025111|2018-01-01T00:00:00.000Z|POINT (-82.7165 34.9168)
10 719026938=719026938|2018-01-01T00:00:00.000Z|POINT (-77 40.1254)

Returned 138 total features

Cleaning up test data
Done
Looking at the Code
The source code is meant to be accessible for this tutorial. The main logic is contained in the generic org.geomesa.example.quickstart.GeoMesaQuickStart in the geomesa-tutorials-common module, which is datastore agnostic. Some relevant methods are:
createDataStoreget a datastore instance from the input configurationcreateSchemacreate the schema in the datastore, as a pre-requisite to writing datawriteFeaturesuse aFeatureWriterto write features to the datastorequeryFeaturesrun several queries against the datastorecleanupdelete the sample data and dispose of the datastore instance
The quickstart uses a small subset of GDELT data. Code for parsing the data into GeoTools SimpleFeatures is contained in org.geomesa.example.data.GDELTData:
getSimpleFeatureTypecreates theSimpleFeatureTyperepresenting the datagetTestDataparses an embedded TSV file to createSimpleFeatureobjectsgetTestQueriesillustrates several different query types, using CQL (GeoTools’ Contextual Query Language)
Visualize Data (optional)
There are two options to visual the data ingested by this quick start. The easiest option is to use the export command of the GeoMesa HBase tools distribution. For a more production ready example, you can alternatively stand up a GeoServer and connect it to your HBase instance.
Visualize Data With Leaflet
Warning
To successfully run this command you must have a computer that is connected to the internet in order to access external Leaflet resources.
The export command is a part of the GeoMesa HBase command-line tools. In order to use the command, ensure you have the command-line tools installed as described in Setting up the HBase Command Line Tools. The export command provides the leaflet format which will export the features to a Leaflet map that you can open in your web browser. To produce the map, run the following command from the GeoMesa HBase tools distribution directory:
bin/geomesa-hbase export            \
    --output-format leaflet         \
    --feature-name gdelt-quickstart \
    --zookeepers <zookeepers>       \
    --catalog <table>
Where the connection parameters are the same you used above during the quickstart. To view the map simply open the url provided by the command in your web browser. If you click the menu in the upper right of the map you can enable and disable the heatmap and feature layers as well as the two provided base layers.
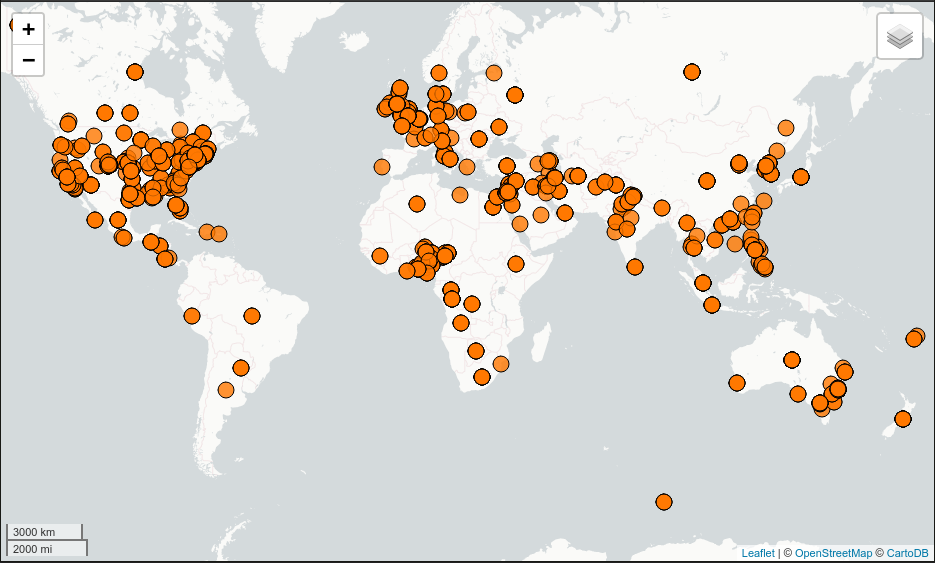
Visualizing quick-start data with Leaflet
Visualize Data With GeoServer
You can use GeoServer to access and visualize the data stored in GeoMesa. In order to use GeoServer, download and install version 2.17.3. Then follow the instructions in Installing GeoMesa HBase in GeoServer to enable GeoMesa.
Register the GeoMesa Store with GeoServer
Log into GeoServer using your user and password credentials. Click “Stores” and “Add new Store”. Select the HBase (GeoMesa) vector data source, and fill in the required parameters.
Basic store info:
workspacethis is dependent upon your GeoServer installationdata source namepick a sensible name, such asgeomesa_quick_startdescriptionthis is strictly decorative;GeoMesa quick start
Connection parameters:
- these are the same parameter values that you supplied on the command line when you ran the tutorial; they describe how to connect to the HBase instance where your data reside
Click “Save”, and GeoServer will search your HBase table for any GeoMesa-managed feature types.
Publish the Layer
GeoServer should recognize the gdelt-quickstart feature type, and should present that as a layer that can be published. Click on the “Publish” link.
You will be taken to the “Edit Layer” screen. You will need to enter values for the data bounding boxes. In this case, you can click on the link to compute these values from the data.
Click on the “Save” button when you are done.
Take a Look
Click on the “Layer Preview” link in the left-hand gutter. If you don’t see the quick-start layer on the first page of results, enter the name of the layer you just created into the search box, and press <Enter>.
Once you see your layer, click on the “OpenLayers” link, which will open a new tab. You should see a collection of red dots similar to the following image:
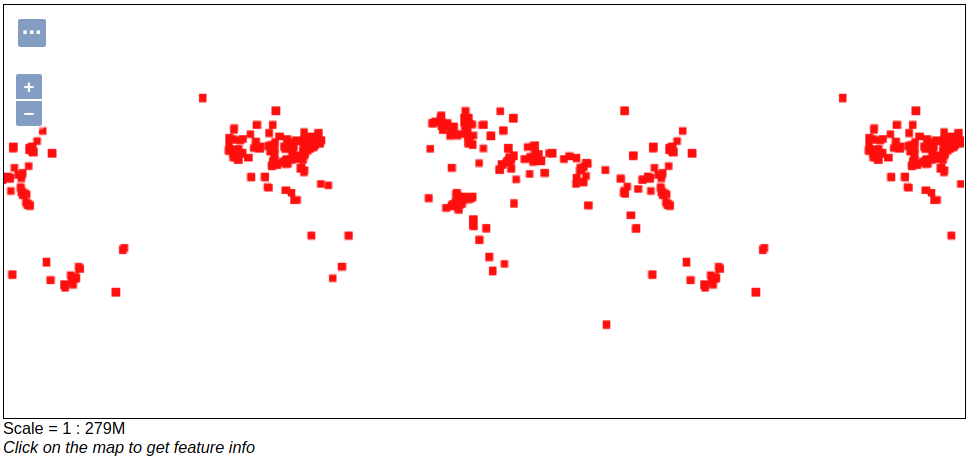
Visualizing quick-start data with GeoServer
Tweaking the display
Here are just a few simple ways you can play with the visualization:
- Click on one of the red points in the display, and GeoServer will report the detail records underneath the map area.
- Shift-click to highlight a region within the map that you would like to zoom into.
- Click on the “Toggle options toolbar” icon in the upper-left corner of the preview window. The right-hand side of the screen will include a “Filter” text box. Enter
EventCode = '051', and press on the “play” icon. The display will now show only those points matching your filter criterion. This is a CQL filter, which can be constructed in various ways to query your data. You can find more information about CQL from GeoServer’s CQL tutorial.
Generating Heatmaps
- To try out server-side processing, you can install the Heatmap SLD from the Map-Reduce Ingest of GDELT tutorial.
- After configuring the SLD, in the URL, change
styles=to bestyles=heatmap. Once you press<Enter>, the display will change to a density heat-map.
Note
For this to work, you will have to first install the WPS module for GeoServer as described in GeoServer Plugins.