在前端页面开发过程中偶尔会有需要对数据进行相应的数学模型展示,或者地理位置的动态展示,可能就会想到用canvas,网上有很多已经集成好的,比如说类似echarts,确实功能非常强大,而且用到了canvas,所以对canvas的使用研究了以下,做一下总结,方便复习。
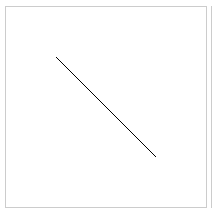
1.利用canvas画一条线:
首先,在页面定义一个canvas标签
<canvas id="line" width="200" height="200"></canvas>然后js中开始绘制
var line = document.getElementById('line');
if(line.getContext){
    var lineCtx = line.getContext('2d');
    lineCtx.moveTo(50,50);
    lineCtx.lineTo(150,150);
    lineCtx.stroke();
}
首先找到需要绘制图像的画布元素,然后if判断浏览器是否支持canvas,支持以后,就开始绘制,画一条线的步骤非常简单,定义起始位置坐标后,stroke()函数,绘制;
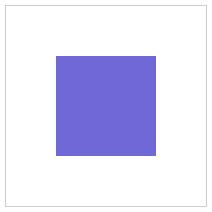
2.利用canvas画一个矩形:
<canvas id="rect" width="200" height="200"></canvas>var rect = document.getElementById('rect');
if(rect.getContext){
var rectCtx = rect.getContext('2d');
rectCtx.fillStyle = '#7068D6';
rectCtx.fillRect(50,50,100,100);
}fillStyle用来填充矩形的颜色,fillRect(x,y,width,height)填充矩形;
3.利用canvas来绘制圆形:
<canvas id="circle" width="200" height="200"></canvas>var circle = document.getElementById('circle');
if(circle.getContext){
var circleCtx = circle.getContext('2d');
circleCtx.beginPath();
circleCtx.arc(100,100,50,0,2*Math.PI);
circleCtx.stroke();
}绘制圆形跟矩形有点区别,需要先beginPath(),然后利用arc(圆心x轴坐标,圆心y轴坐标,半径长度,起始度数,结束度数),圆形绘制时是顺时针开始,所以如果想绘制弧形,要知道怎么弄。
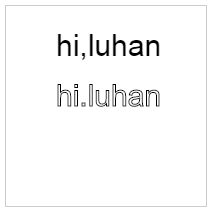
4.绘制文字:
<canvas id="txt" width="200" height="200"></canvas>var txt = document.getElementById('txt');
if(txt.getContext){
var txtCtx = txt.getContext('2d');
txtCtx.font = '30px Arial';
txtCtx.fillText('hi,luhan',50,50);
txtCtx.strokeText('hi.luhan',50,100);
}绘制文字有几个参数可以设置,font、fillText(‘要绘制的文字’,x,y),注意fillText是填充文字,所以绘制出来的是实心文字,strokeText(‘要绘制的文字’,x,y)绘制的是空心文字;
5.结合以上几种绘图方式,绘制一个笑脸:
<canvas id="canvas" width="200" height="200"></canvas>var canvas = document.getElementById('canvas');
if(canvas.getContext){
var mapCtx = canvas.getContext('2d');
mapCtx.beginPath();
mapCtx.arc(75, 75, 50, 0, Math.PI * 2, true);
mapCtx.moveTo(110, 75);
mapCtx.arc(75, 75, 35, 0, Math.PI, false);
mapCtx.moveTo(65, 65);
mapCtx.arc(60, 65, 5, 0, Math.PI * 2, true);
mapCtx.moveTo(95, 65);
mapCtx.arc(90, 65, 5, 0, Math.PI * 2, true);
mapCtx.stroke();
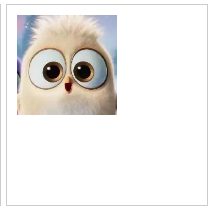
}6.利用canvas绘制静态图片:
<canvas id="img" width="200" height="200"></canvas>var img = document.getElementById('img');
if(img.getContext){
var imgCtx = img.getContext('2d');
var imgEl = new Image();
imgEl.src = 'img/headPic.jpg';
imgEl.onload = function(){
imgCtx.drawImage(imgEl,10,10,100,100);
}
}等待图片资源加载完毕,开始绘制drawImage(图片元素,x,y,width,height);
以上就是对canvas绘制各种图形的总结,如果想绘制复杂的图形,可能就需要用集成好的组件更方便,数据转图形类的推荐echarts,官方实例超多,echarts实例展示
如果想要酷炫动画,推荐17素材网站
最后,在前端开发过程中,如果只是需要某一部分的实现需要canvas,就可以直接用网上大家集成好的,基本原理懂了,如果用的过程中有什么问题也是能猜个大概,不必浪费太多时间。


