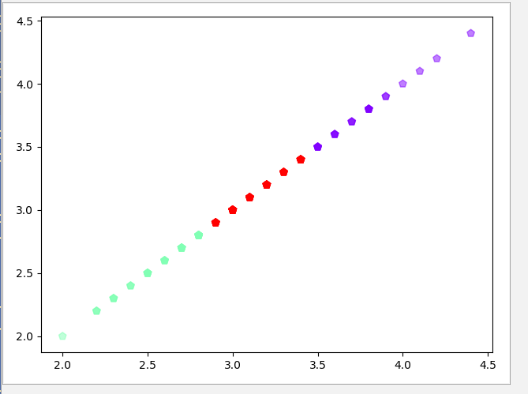
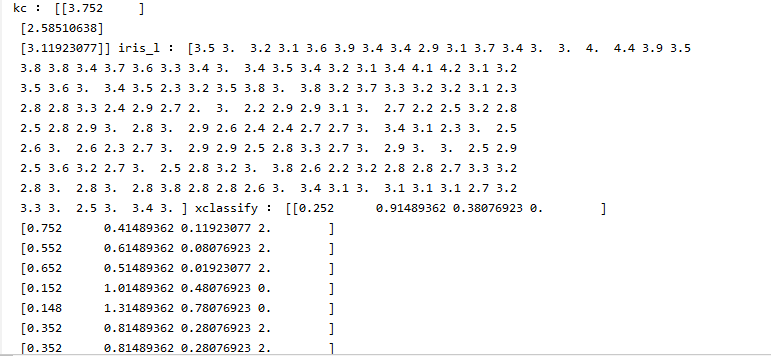
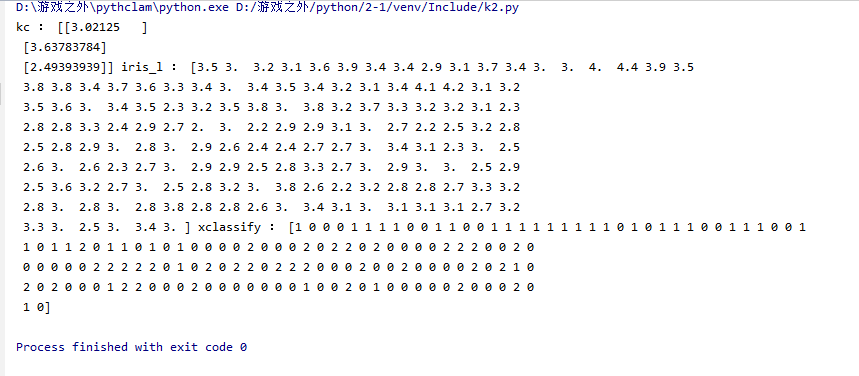
自主编写K-means算法 ,以鸢尾花花瓣长度数据做聚类,并用散点图显示。
from numpy import *
import matplotlib.pyplot as plt
import numpy as np
from sklearn.datasets import load_iris

data= load_iris()
iris_l = data.data[:,1:2]

y= len(iris_l)#150
m = iris_l.shape[1]#1
k = 3
dist = np.zeros([y,k+1])

#center
def initcent(x, k):
    center = x[:k, :]
    return center

#oushijuli
def nearest(x, center):
    a=[]
    for j in range(k):
        a.append(abs(x-center[j,:]))
        # print(a)
    return a

#julei
def xclassify(x,dist, center):
    for i in range(x.shape[0]):
        dist[i,:k]=nearest(x[i,:],center)
        dist[i, k] = np.argmin(dist[i,:k])
    return dist

def kcmean(x, dist, center, k):
    centerNew = np.zeros([k,m])
    for c in range(k):
        q = np.where(dist[:,k] == c)
        n = np.mean(x[q])
        if centerNew[c] != n:
            centerNew[c] = n
    return np.array(centerNew)

center = initcent(iris_l,k)
while True:
    xclas = xclassify(iris_l, dist, center)
    centerNew=kcmean(iris_l, xclas, center, k)
    if all(center == centerNew):
        break
    else:
        center = centerNew

a = iris_l.flatten()
plt.scatter(a, a, c=array(xclas[:,k]), s=50, cmap='rainbow', marker='p', alpha=0.5)
plt.show()
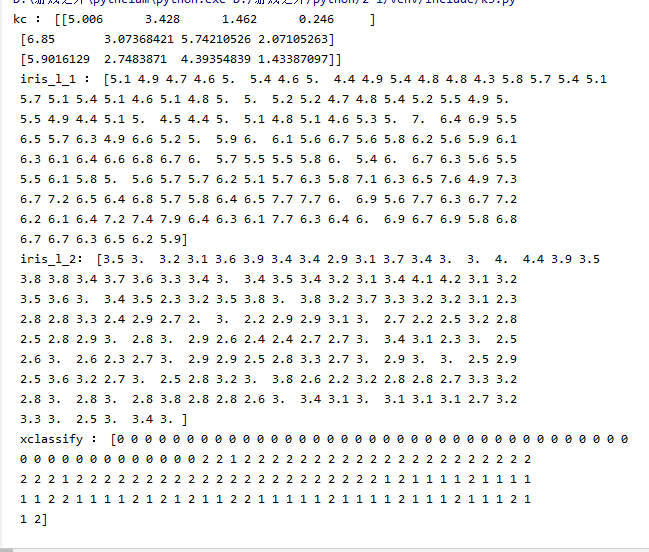
用sklearn.cluster.KMeans,鸢尾花花瓣长度数据做聚类,并用散点图显示
from sklearn.datasets import load_iris
import matplotlib.pyplot as plt
from sklearn.cluster import KMeans
iris = load_iris()
data = iris['data']
long = data[:,1]
long = long.reshape(-1,1)

model = KMeans(n_clusters=3).fit(long)
pre = model.predict(long)
center = model.cluster_centers_
# print(long[:,0])

plt.scatter(long[:,0], long[:,0], c=pre, s=50, cmap='rainbow', marker='p', alpha=0.5)
plt.show()

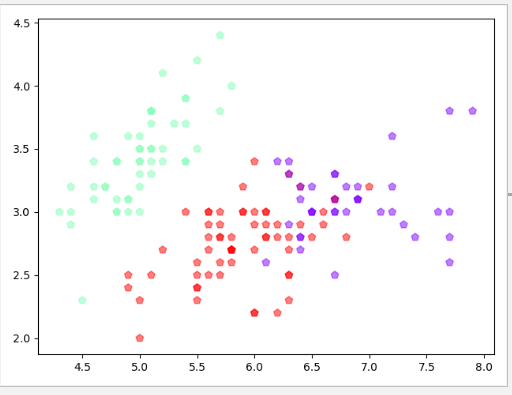
鸢尾花完整数据做聚类并用散点图显示.
from sklearn.datasets import load_iris
import matplotlib.pyplot as plt
from sklearn.cluster import KMeans
iris = load_iris()
data = iris['data']

model = KMeans(n_clusters=3).fit(data)
pre = model.predict(data)
center = model.cluster_centers_

plt.scatter(data[:,0], data[:,1], c=pre, s=50, cmap='rainbow', marker='p', alpha=0.5)
plt.show()