import numpy as np
import matplotlib .pyplot as plt
import pandas as pd
from sklearn.neighbors import KNeighborsClassifier
# 加载数据
img_arr = plt.imread('./data/8/8_88.bmp')
plt.imshow(img_arr)
<matplotlib.image.AxesImage at 0x1786b073780>
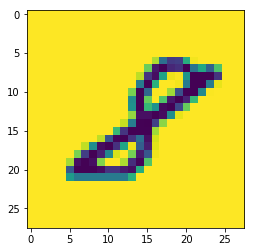
img_arr.shape # 图片的像素为28*28,对应的numpy数组是二维
(28, 28)
# 提取样本数据
feature = []
target = []
for i in range(10): # i表示的文件夹的名称
    for j in range(1,501):
        img_path = './data/'+str(i)+'/'+str(i)+'_'+str(j)+'.bmp'
        img_arr = plt.imread(img_path)
        feature.append(img_arr)
        target.append(i)
# 提取样本数据
feature = np.array(feature)  # 必须保证是二维
target = np.array(target)
feature.shape # 目前的特征是3维
(5000, 28, 28)
# 特征处理:将三维的特征变形成二维
feature = feature.reshape((5000,-1))
feature.shape
(5000, 784)
-
总结:feature特征数据中存放是5000个一维的图片数据
-
对样本数据进行拆分
# 对样本数据进行打乱
np.random.seed(10)
np.random.shuffle(feature)
np.random.seed(10)
np.random.shuffle(target)
# 拆分
x_train = feature[:4950]
y_train = target[:4950]
x_test = feature[4950:]
y_test = target[4950:]
- 实例化模型对象,然后对其进行训练
knn = KNeighborsClassifier(n_neighbors=5)
knn.fit(x_train,y_train)
knn.score(x_test,y_test)
0.98
print('真实的分类结果:',y_test)
print('模型的分类结果:',knn.predict(x_test))
真实的分类结果: [1 2 2 3 9 1 7 9 8 5 5 4 9 0 7 0 3 5 0 7 2 7 1 2 0 8 8 6 1 1 6 6 4 4 0 8 5
 8 2 2 4 3 3 9 4 2 6 2 9 2]
模型的分类结果: [1 2 2 3 9 1 7 9 8 5 5 4 9 0 7 0 3 5 0 7 2 7 1 2 0 8 8 6 1 1 6 6 4 4 0 8 5
 8 2 2 4 3 3 9 4 1 6 2 9 2]
- 保存模型
from sklearn.externals import joblib
joblib.dump(knn,'./knn.m')
['./knn.m']
knn = joblib.load('./knn.m')
knn
KNeighborsClassifier(algorithm='auto', leaf_size=30, metric='minkowski',
           metric_params=None, n_jobs=1, n_neighbors=5, p=2,
           weights='uniform')
- 使用模型识别外部的数字图片
img_arr = plt.imread('./数字.jpg')
plt.imshow(img_arr)
<matplotlib.image.AxesImage at 0x1786b3da7b8>
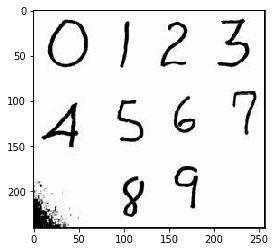
img_arr.shape
(241, 257, 3)
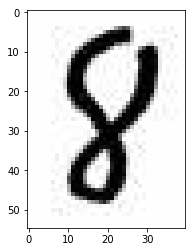
eight_img = img_arr[180:235,90:130,:]
plt.imshow(eight_img)
<matplotlib.image.AxesImage at 0x1786bc14e48>
feature[0].shape # 模型可以识别的图片
(784,)
- 模型可以识别的图片的维度是取决于样本数据的
- 可以识别的图片是28*28像素
- 图片是没有颜色这个维度
- 模型识别的图片(784,)
eight_img.shape
(55, 40, 3)
eight_img = eight_img.mean(axis=2) # 降维
eight_img.shape
(55, 40)
- 对降维之后的图片的像素进行等比例压缩
import scipy.ndimage as ndimage
eight_img = ndimage.zoom(eight_img,zoom=(28/55,28/40))
eight_img.shape
C:anaconda3libsite-packagesscipy
dimageinterpolation.py:616: UserWarning: From scipy 0.13.0, the output shape of zoom() is calculated with round() instead of int() - for these inputs the size of the returned array has changed.
  "the returned array has changed.", UserWarning)


(28, 28)
eight_img = eight_img.reshape(1,-1)
eight_img.shape
(1, 784)
knn.predict(eight_img)
array([8])