官网介绍:
Matplotlib is a Python 2D plotting library which produces publication quality figures in a variety of hardcopy formats and interactive environments across platforms. Matplotlib can be used in Python scripts, the Python and IPython shell, the jupyter notebook, web application servers, and four graphical user interface toolkits.
呃。。。Matplotlib就是一个Python 2D绘图库,可以用来在多种多样的硬拷贝格式和交互环境中生成publication quality figures(看不懂),什么样的图形(字面翻译,出版质量的图形?不通顺啊。),Matplotlib可以用在python脚本,python和ipython shell,the jupyter notebook,web应用服务器,和四种图形化用户界面工具。
这蹩脚的英语水平。。
反正是用来画图的,至于它的应用领域,上述讲的不是很清楚,以后再慢慢探索吧。
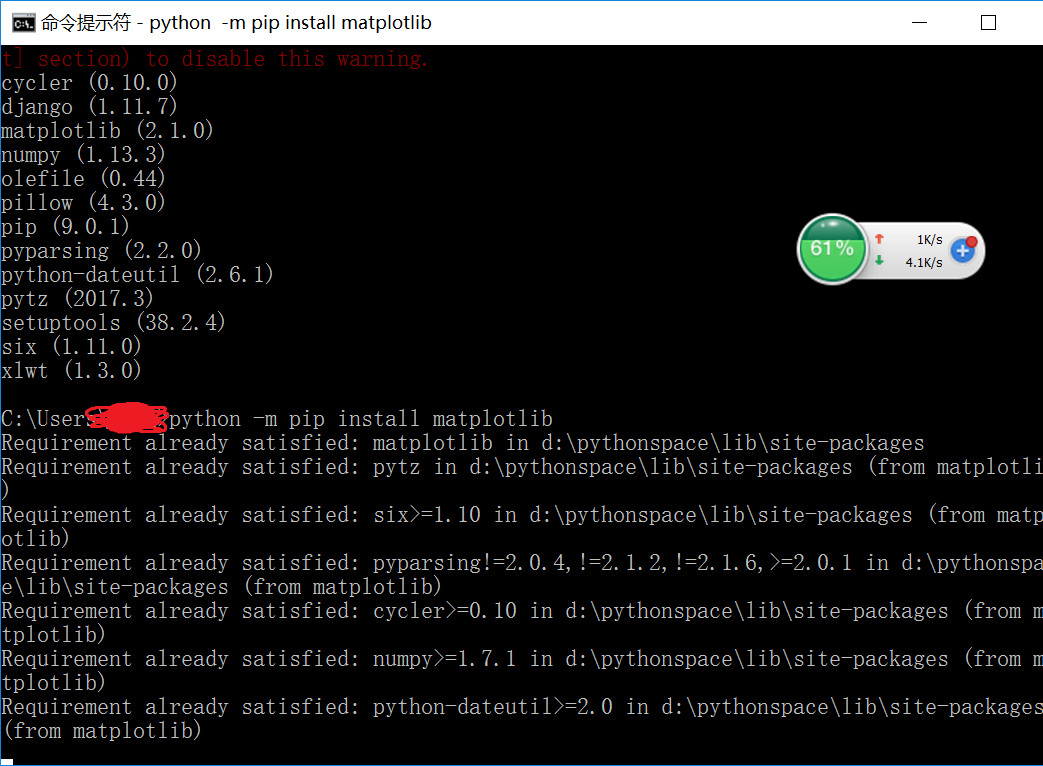
下面看看安装过程,十分简单。
命令窗口直接输入:python -m pip install matplotlib
然后回车即可。

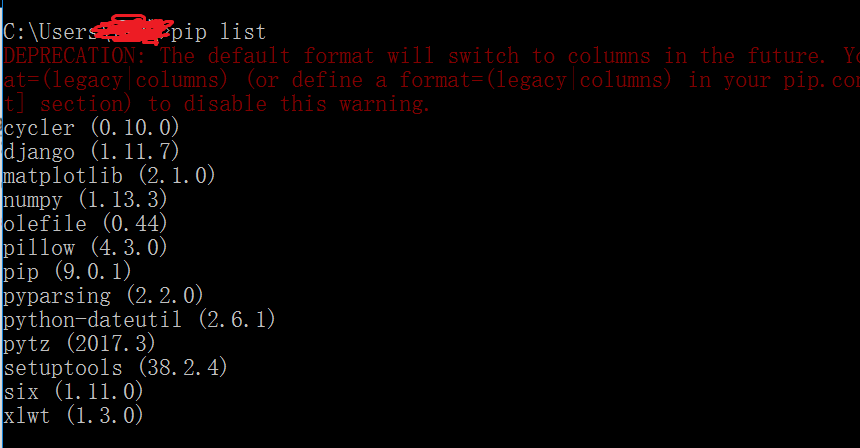
检查是否安装成功

导入matplotlib,不报错即可。
或者在命令行里输入“pip list”,查看本机已安装的python模块。

matplotlib简单实例:
import numpy as np
import matplotlib.pyplot as plt

# 平均采样时间为200ms
t = np.arange(0., 5., 0.2)

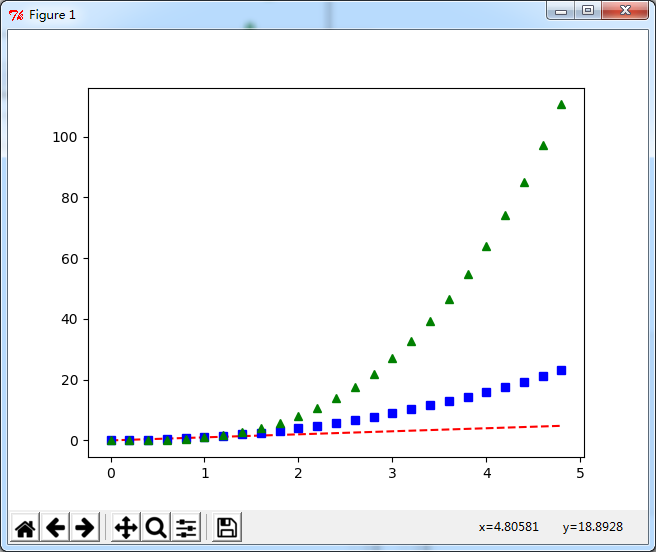
# 红色的破折号,蓝色的正方形,绿色的三角形
plt.plot(t, t, 'r--', t, t**2, 'bs', t, t**3, 'g^')
plt.show()
运行结果:

referance:
新手上路,欢迎讨论一些python方面的知识。