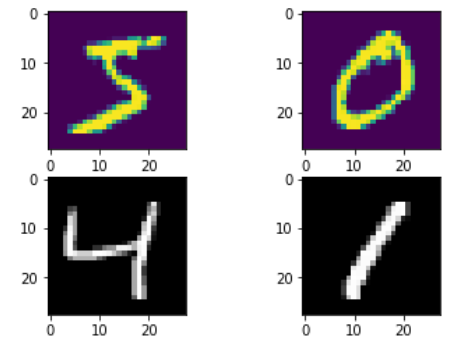
用Jupyter notebook,显示MNIST
 1 %matplotlib inline
 2
 3 from keras.datasets import mnist
 4 import matplotlib.pyplot as plt
 5
 6 # loading data
 7 (X_train, y_train), (X_test, y_test) = mnist.load_data()
 8
 9 fig = plt.figure()
10 ax = fig.add_subplot(221)   #第一个子图
11
12 ax.imshow(X_train[0])   #默认配置
13
14 ax = fig.add_subplot(222)   #第二个子图
15
16 ax.imshow(X_train[1])
17
18 ax = fig.add_subplot(223)   #第三个子图
19
20 ax.imshow(X_train[2],cmap = plt.cm.gray)   #第三个子图,使用灰度图
21
22 ax = fig.add_subplot(224)   #第四个子图
23
24 ax.imshow(X_train[3],cmap = plt.cm.gray)   #第四个子图,使用灰度图
25
26 plt.show()   #显示图像
结果:
