这里摘抄一篇通俗易懂的文章,方便大家与后端衔接。。。。。。。
使用python的web框架Flask作为后台,数据存储使用sqllite3,前端的展示用开源图标插件echarts。
使用sqllite作为数据库存储数据,创建create_db.py,这里是虚拟数据,思路也是参考别人的博客

# coding=utf-8
import sqlite3

import sys
reload(sys)
sys.setdefaultencoding('utf-8')
# 连接
conn = sqlite3.connect('mydb.db')
conn.text_factory = str
c = conn.cursor()

# 创建表
c.execute('''DROP TABLE IF EXISTS weather''')
c.execute('''CREATE TABLE weather (month text, evaporation text, precipitation text)''')

# 数据
# 格式:月份,蒸发量,降水量
purchases = [('1月', 2, 2.6),
             ('2月', 4.9, 5.9),
             ('3月', 7, 9),
             ('4月', 23.2, 26.4),
             ('5月', 25.6, 28.7),
             ('6月', 76.7, 70.7),
             ('7月', 135.6, 175.6),
             ('8月', 162.2, 182.2),
             ('9月', 32.6, 48.7),
             ('10月', 20, 18.8),
             ('11月', 6.4, 6),
             ('12月', 3.3, 2.3)
             ]

# 插入数据
c.executemany('INSERT INTO weather VALUES (?,?,?)', purchases)

# 提交!!!
conn.commit()


# 查询方式一
for row in c.execute('SELECT * FROM weather'):
    print(row)

# 查询方式二
c.execute('SELECT * FROM weather')
print(c.fetchall())

# 查询方式二_2
res = c.execute('SELECT * FROM weather')
print(res.fetchall())


# 关闭
conn.close()
使用python的web框架flask,搭建一个简答的后台系统
app.py
import sqlite3
from flask import Flask, request, render_template, jsonify
import sys
reload(sys)
sys.setdefaultencoding('utf-8')

app = Flask(__name__)


def get_db():
    db = sqlite3.connect('mydb.db')

    db.row_factory = sqlite3.Row
    return db


def query_db(query, args=(), one=False):
    db = get_db()
    cur = db.execute(query, args)
    db.commit()
    rv = cur.fetchall()
    db.close()
    return (rv[0] if rv else None) if one else rv


@app.route("/", methods=["GET"])
def index():
    return render_template("index.html")


@app.route("/weather", methods=["GET"])
def weather():
    if request.method == "GET":
        res = query_db("SELECT * FROM weather")

    return jsonify(month=[x[0] for x in res],
                   evaporation=[x[1] for x in res],
                   precipitation=[x[2] for x in res])

@app.route('/map')
def map():
    return render_template('map.html')


if __name__ == "__main__":
    app.run(debug=True)
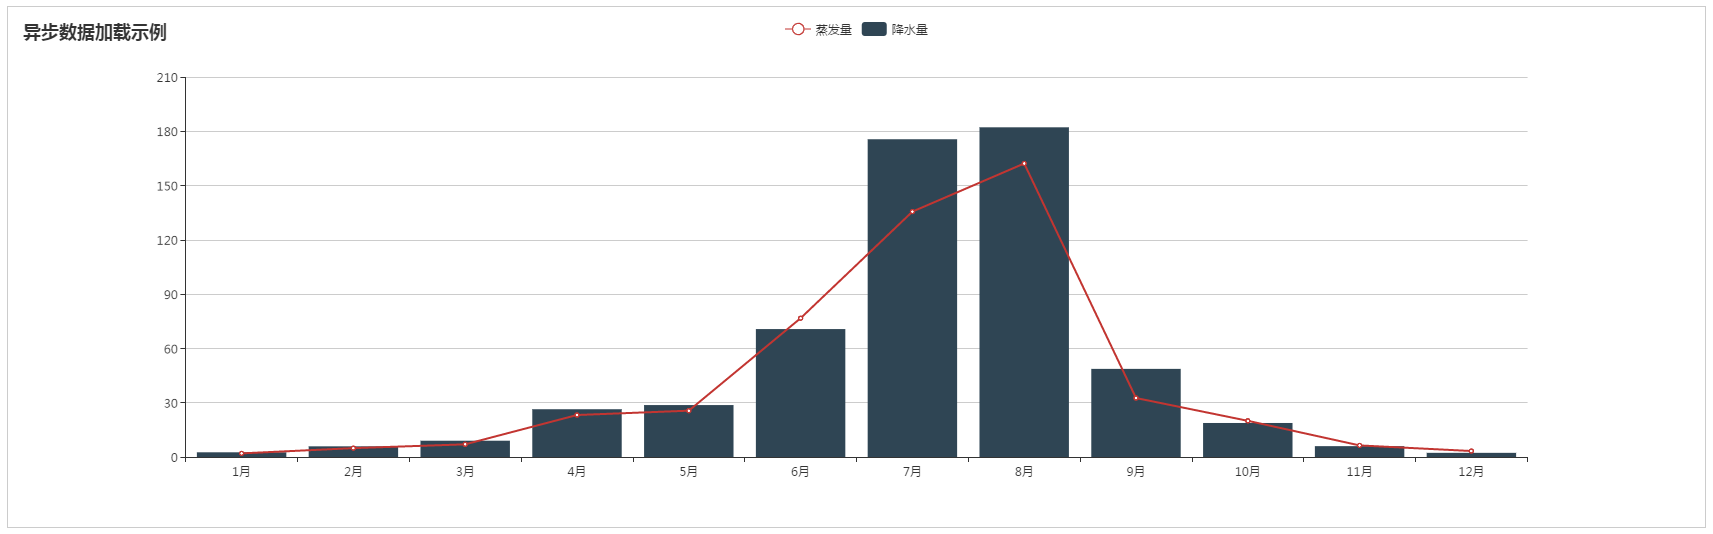
最后在前端页面展示数据,使用百度开源图表插件echarts
<!DOCTYPE html>
<html lang="en">
<head>
    <meta charset="utf-8">
    <title>ECharts3 Ajax</title>
    <script src="{{ url_for('static', filename='jquery-3.2.1.min.js') }}"></script>
    <script src="{{ url_for('static', filename='echarts.js') }}"></script>
</head>

<body>
    <!--为ECharts准备一个具备大小(宽高)的Dom-->
    <div id="main" style="height:500px;border:1px solid #ccc;padding:10px;"></div>

    <script type="text/javascript">
    var myChart = echarts.init(document.getElementById('main'));

    // 显示标题,图例和空的坐标轴
    myChart.setOption({
        title: {
            text: '异步数据加载示例'
        },
        tooltip: {},
        legend: {
            data:['蒸发量','降水量']
        },
        xAxis: {
            data: []
        },
        yAxis: {},
        series: [{
            name: '蒸发量',
            type: 'line',
            data: []
        },{
            name: '降水量',
            type: 'bar',
            data: []
        }]
    });

    myChart.showLoading(); // 显示加载动画

    // 异步加载数据
    $.get('/weather').done(function (data) {
        myChart.hideLoading(); // 隐藏加载动画

        // 填入数据
        myChart.setOption({
            xAxis: {
                data: data.month
            },
            series: [{
                name: '蒸发量', // 根据名字对应到相应的系列
                data: data.evaporation.map(parseFloat) // 转化为数字(注意map)
            },{
                name: '降水量',
                data: data.precipitation.map(parseFloat)
            }]
        });
    });
    </script>
</body>
</html>
项目结构如下图所示:
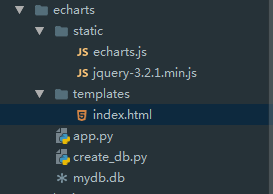
最后运行flask项目,python app.py runserver即可,访问127.0.0.1:5000