from PIL import Image
from matplotlib import pyplot as plt

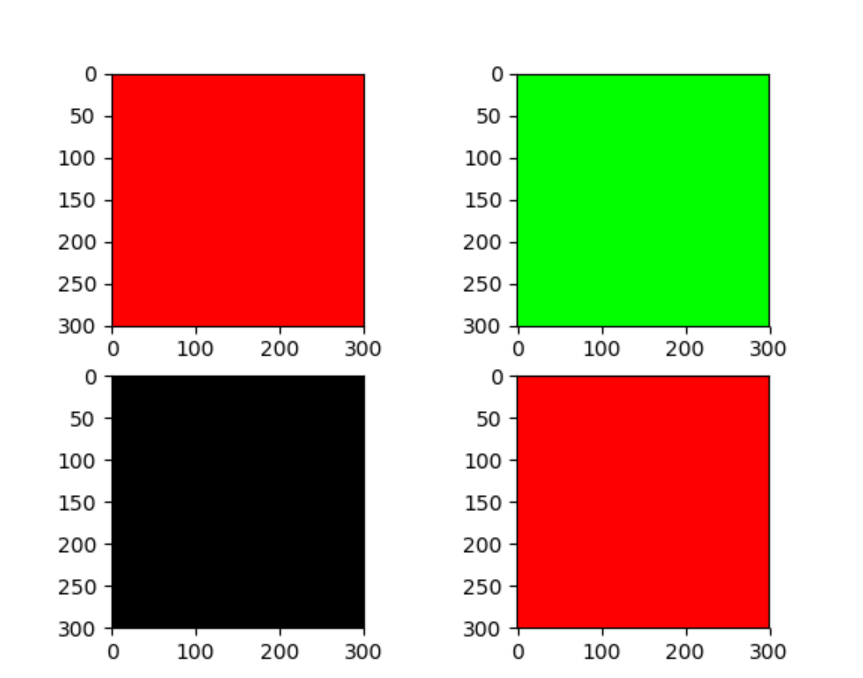
image_1 = Image.new("RGB", (300, 300), "red")
#生成1行四列的第一个图形
plt.subplot(2, 2, 1)
plt.imshow(image_1)
image_2 = Image.new("RGB", (300, 300), "#00FF00")
plt.subplot(2,2,2)
plt.imshow(image_2)
image_3 = Image.new("RGB", (300, 300), 0)
plt.subplot(2,2,3)
plt.imshow(image_3)
image_4 = Image.new("RGB", (300, 300), 255)
plt.subplot(2,2,4)
plt.imshow(image_4)

plt.show()

# image.new的三种表示方法,但是第三个参数直接用数字表示的的方法,并不能理解。
