导入包
import matplotlib.pyplot as plt
柱状图
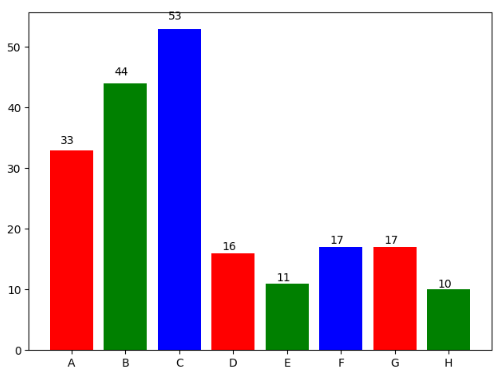
最简柱状图
# 显示高度
def autolabel(rects):
    for rect in rects:
        height = rect.get_height()
        plt.text(rect.get_x()+rect.get_width()/2.- 0.2, 1.03*height, '%s' % int(height))


name_list = ['A', 'B', 'C', 'D', 'E', 'F', 'G', 'H']
num_list = [33, 44, 53, 16, 11, 17, 17, 10]
autolabel(plt.bar(range(len(num_list)), num_list, color='rgb', tick_label=name_list))
plt.show()
结果
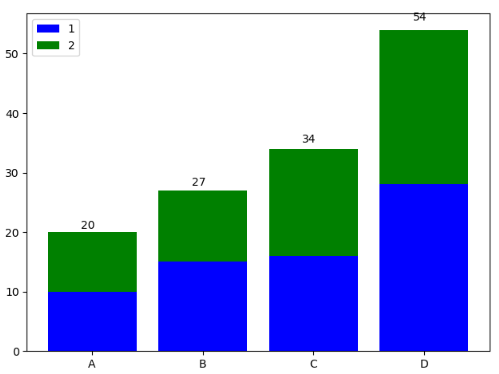
堆叠柱状图
# 显示高度
def autolabel(rects1, rects2):
    i = 0
    for rect1 in rects1:
        rect2 = rects2[i]
        i += 1
        height = rect1.get_height() + rect2.get_height()
        plt.text(rect1.get_x()+rect1.get_width()/2. - 0.1, 1.03*height, '%s' % int(height))


name_list = ['A', 'B', 'C', 'D']
num_list = [10, 15, 16, 28]
num_list2 = [10, 12, 18, 26]
z1 = plt.bar(range(len(num_list)), num_list, label='1', fc='b')
z2 = plt.bar(range(len(num_list)), num_list2, bottom=num_list, label='2', tick_label=name_list, fc='g')
autolabel(z1, z2)
plt.legend()
plt.show()
结果
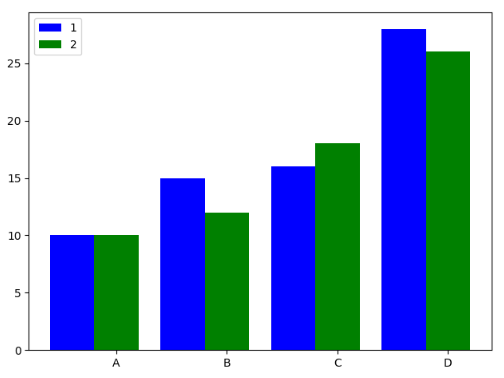
并列柱状图
name_list = ['A', 'B', 'C', 'D']
num_list = [10, 15, 16, 28]
num_list2 = [10, 12, 18, 26]
x = list(range(len(num_list)))
total_width, n = 0.8, 2
width = total_width / n
plt.bar(x, num_list, width=width, label='1', fc='b')
for i in range(len(x)):
    x[i] += width
plt.bar(x, num_list2, width=width, label='2', tick_label=name_list, fc='g')
plt.legend()
plt.show()
结果
饼图
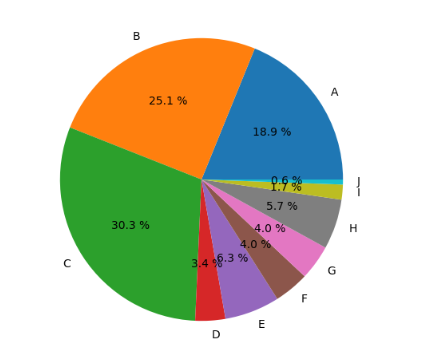
最简饼图
name_list = ['A', 'B', 'C', 'D', 'E', 'F', 'G', 'H', 'I', 'J']
num_list = [33, 44, 53, 6,11, 7, 7, 10, 3, 1]
# 保证圆形
plt.axes(aspect=1)
plt.pie(x=num_list, labels=name_list, autopct='%3.1f %%')
plt.show()
结果
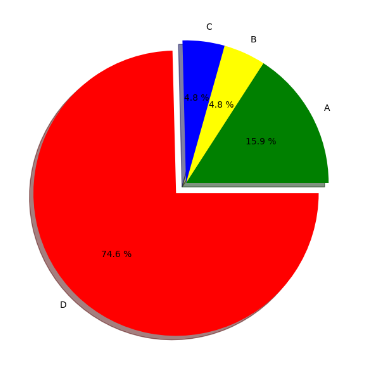
带切割的饼图
name_list = ['A', 'B', 'C', 'D']
num_list = [10, 3, 3, 47]
colors = ['green', 'yellow', 'blue', 'red']
# 圆形
plt.figure(1, figsize=(6, 6))
#决定分割部分,及其与其它部分之间的间距
expl = [0, 0, 0, 0.1]
plt.pie(x=num_list, explode=expl, labels=name_list, autopct='%3.1f %%', colors=colors, shadow=True)
plt.show()
结果