Kaggle机器学习竞赛是全球最著名的人工智能比赛,每个竞赛项目都吸引了大量AI爱好者参与。
这里选择2018年底进行的盐沉积区识别竞赛作为例子:https://www.kaggle.com/c/tgs-salt-identification-challenge
一、数据
可以从Kaggle网站下载,但需先注册,下载速度可能也必将慢。可以直接从我的百度网盘下载:
链接:https://pan.baidu.com/s/1htvnrwQagOXHXfjpaGedPQ
提取码:a0zx
二、unet++模型开源代码
unet++是2018年被提出的网络模型,是对unet的优化,在图像分割中有优异的表现。采用的源码见:https://github.com/MrGiovanni/UNetPlusPlus
三、数据处理及准备
导入包:
import os
import random
import matplotlib.pyplot as plt

import pandas as pd
import numpy as np

from sklearn.model_selection import train_test_split
from skimage.transform import resize

from UNetPlusPlus_master.segmentation_models import Xnet

from keras.preprocessing.image import load_img
from keras.optimizers import *
from keras.callbacks import EarlyStopping, ModelCheckpoint
数据位置、尺寸:
root = r'E:Kagglesaltcompetition_data'
model_path = root + '/model'

imgs_path = root + r'	rain'
test_imgs_path = root + r'	est'

train_csv = root + r'	rain.csv'
depths_csv = root + r'depths.csv'
orig_img_w = 101
orig_img_h = 101

train_img_w = 224
train_img_h = 224
原尺寸和训练尺寸转换:
def orig2tain(img):
    return resize(img, (train_img_w, train_img_h), mode='constant', preserve_range=True)

def train2orig(img):
    return resize(img, (orig_img_w, orig_img_h), mode='constant', preserve_range=True)
读入数据:
train_df = pd.read_csv(train_csv, usecols=[0], index_col='id')
train_df["images"] = [np.array(load_img("{}/images/{}.png".format(imgs_path, idx), grayscale=False)) / 255 for idx in train_df.index]
train_df["masks"] = [np.array(load_img("{}/masks/{}.png".format(imgs_path, idx), grayscale=True)) / 255 for idx in train_df.index]
显示读入结果:
max_images = 10
grid_width = 10
grid_height = int(max_images / grid_width) + 1
fig, axs = plt.subplots(grid_height, grid_width, figsize=(20, 4))

for i, idx in enumerate(train_df.index[:max_images]):
    img = train_df.loc[idx].images
    mask = train_df.loc[idx].masks
    ax = axs[int(i / grid_width), i % grid_width]
    ax.imshow(img, cmap="Greys")
    ax = axs[int(i / grid_width)+1, i % grid_width]
    ax.imshow(mask, cmap="Greens")
    ax.set_yticklabels([])
    ax.set_xticklabels([])

plt.show()

按2:8随机分训练集、验证集:
train_ids, valid_ids, train_x, valid_x, train_y, valid_y = train_test_split(
    train_df.index.values,
    np.array(train_df.images.map(orig2tain).tolist()).reshape(-1, train_img_w, train_img_h, 3),
    np.array(train_df.masks.map(orig2tain).tolist()).reshape(-1, train_img_w, train_img_h, 1),
    test_size=0.2,
    random_state=123)
四、训练
input_size = (train_img_w, train_img_h, 3)
model = Xnet(input_shape=input_size, backbone_name='resnet50', encoder_weights='imagenet', decoder_block_type='transpose')
model.compile(optimizer = Adam(lr = 1e-4), loss = 'binary_crossentropy', metrics = ['accuracy'])

model_name = 'Kaggle_Salt_{epoch:02d}-{val_acc:.3f}.hdf5'
abs_model_name = os.path.join(model_path, model_name)

model_checkpoint = ModelCheckpoint(abs_model_name, monitor='val_loss', verbose=2, save_best_only=True)
early_stop = EarlyStopping(monitor='val_loss', patience=6)
callbacks = [early_stop, model_checkpoint]
history = model.fit(train_x, train_y,
                    validation_data=[valid_x, valid_y],
                    epochs=100,
                    batch_size=4,
                    callbacks=callbacks)
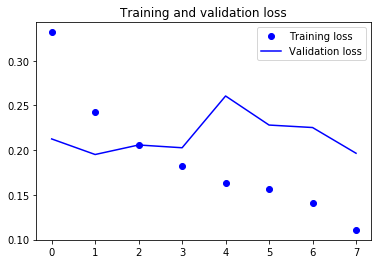
显示训练曲线:
    acc = history.history['acc']
    val_acc = history.history['val_acc']
    loss = history.history['loss']
    val_loss = history.history['val_loss']

    epochs = range(len(acc))

    plt.plot(epochs, acc, 'bo', label='Training acc')
    plt.plot(epochs, val_acc, 'b', label='Validation acc')
    plt.title('Training and validation accuracy')
    plt.legend()

    plt.figure()

    plt.plot(epochs, loss, 'bo', label='Training loss')
    plt.plot(epochs, val_loss, 'b', label='Validation loss')
    plt.title('Training and validation loss')
    plt.legend()

    plt.show()

