【心跳信号分类预测】Datawhale打卡- Task 2 数据分析
教程里的数据分析基本没有意义,核心数据列为heartbeat_signals,这个才是重点,并且需要考虑到该列的时序意义。
尝试从:
- 分解heartbeat_signals的所有列
- 绘制前10个的心电图的plot图
- 绘制label为1的分别的10个plot图
import pandas as pd
win_file_path = 'E:\competition-data\016_heartbeat_signals\'
train = pd.read_csv(win_file_path+'train.csv')
test = pd.read_csv(win_file_path+'testA.csv')
输出行列信息
print('train.shape', train.shape)
print('test.shape', test.shape)
train.shape (100000, 3)
test.shape (20000, 2)
train.head(1)
| id | heartbeat_signals | label | |
|---|---|---|---|
| 0 | 0 | 0.9912297987616655,0.9435330436439665,0.764677... | 0.0 |
判断数据缺失和异常 (都没有)
data.isnull().sum()——查看每列的存在nan情况
train.isnull().sum()
id                   0
heartbeat_signals    0
label                0
dtype: int64
test.isnull().sum()
id                   0
heartbeat_signals    0
dtype: int64
了解预测值的分布
train['label'].describe()
count    100000.000000
mean          0.856960
std           1.217084
min           0.000000
25%           0.000000
50%           0.000000
75%           2.000000
max           3.000000
Name: label, dtype: float64
train['label'].value_counts()
0.0    64327
3.0    17912
2.0    14199
1.0     3562
Name: label, dtype: int64
2.3.7 用pandas_profiling生成数据报告
import pandas_profiling
pfr = pandas_profiling.ProfileReport(data_train)
pfr.to_file("./example.html")
这里完全不适用, pandas_profiling, 至少目前来说.
尝试 独立的数据分析:
- 分解heartbeat_signals的所有列
- 绘制前5个的心电图的plot图
- 绘制label为0-3的分别的5个plot重叠图
分解heartbeat_signals的所有列
train['heartbeat_signals'] = train['heartbeat_signals'].astype('string')
x = train['heartbeat_signals'].str.split(",", expand=True)
x
| 0 | 1 | 2 | 3 | 4 | 5 | 6 | 7 | 8 | 9 | ... | 195 | 196 | 197 | 198 | 199 | 200 | 201 | 202 | 203 | 204 | |
|---|---|---|---|---|---|---|---|---|---|---|---|---|---|---|---|---|---|---|---|---|---|
| 0 | 0.9912297987616655 | 0.9435330436439665 | 0.7646772997256593 | 0.6185708990212999 | 0.3796321642826237 | 0.19082233510621885 | 0.040237131594430715 | 0.02599520771717858 | 0.03170886048677242 | 0.06552357497104398 | ... | 0.0 | 0.0 | 0.0 | 0.0 | 0.0 | 0.0 | 0.0 | 0.0 | 0.0 | 0.0 |
| 1 | 0.9714822034884503 | 0.9289687459588268 | 0.5729328050711678 | 0.1784566262750076 | 0.1229615224365985 | 0.13236021729815928 | 0.09439236984499814 | 0.08957535516351411 | 0.030480606866741047 | 0.04049936195430977 | ... | 0.0 | 0.0 | 0.0 | 0.0 | 0.0 | 0.0 | 0.0 | 0.0 | 0.0 | 0.0 |
| 2 | 1.0 | 0.9591487564065292 | 0.7013782792997189 | 0.23177753487886463 | 0.0 | 0.08069805776387916 | 0.12837603937503544 | 0.18744837555079963 | 0.28082571505275855 | 0.3282610568488903 | ... | 0.0 | 0.0 | 0.0 | 0.0 | 0.0 | 0.0 | 0.0 | 0.0 | 0.0 | 0.0 |
| 3 | 0.9757952826275774 | 0.9340884687738161 | 0.6596366611990001 | 0.2499208267606008 | 0.23711575621286213 | 0.28144491730834825 | 0.2499208267606008 | 0.2499208267606008 | 0.24139674778512604 | 0.2306703464848836 | ... | 0.0 | 0.0 | 0.0 | 0.0 | 0.0 | 0.0 | 0.0 | 0.0 | 0.0 | 0.0 |
| 4 | 0.0 | 0.055816398940721094 | 0.26129357194994196 | 0.35984696254197834 | 0.43314263962884686 | 0.45369772898632504 | 0.49900406742109477 | 0.5427959768500487 | 0.6169044962835193 | 0.6766958323316207 | ... | 0.0 | 0.0 | 0.0 | 0.0 | 0.0 | 0.0 | 0.0 | 0.0 | 0.0 | 0.0 |
| ... | ... | ... | ... | ... | ... | ... | ... | ... | ... | ... | ... | ... | ... | ... | ... | ... | ... | ... | ... | ... | ... |
| 99995 | 1.0 | 0.677705342021188 | 0.22239242747868546 | 0.2571578307224994 | 0.20469042415279454 | 0.05466497618736314 | 0.026152286890497062 | 0.11818142707296006 | 0.24483757081121627 | 0.3289485158861968 | ... | 0.0 | 0.0 | 0.0 | 0.0 | 0.0 | 0.0 | 0.0 | 0.0 | 0.0 | 0.0 |
| 99996 | 0.9268571578157265 | 0.9063471198026871 | 0.6369932212888393 | 0.41503751002775946 | 0.37474480119929776 | 0.3825812845814957 | 0.35894293360916163 | 0.34135861850914284 | 0.3365254578264915 | 0.3170292884548231 | ... | 0.0 | 0.0 | 0.0 | 0.0 | 0.0 | 0.0 | 0.0 | 0.0 | 0.0 | 0.0 |
| 99997 | 0.9258351628306013 | 0.5873839035878395 | 0.6332261741951388 | 0.6323533645350808 | 0.6392827243034813 | 0.6142923239940205 | 0.5991551019747257 | 0.5176324324889339 | 0.4038033525475481 | 0.2531748788594435 | ... | 0.0 | 0.0 | 0.0 | 0.0 | 0.0 | 0.0 | 0.0 | 0.0 | 0.0 | 0.0 |
| 99998 | 1.0 | 0.9947621698382489 | 0.8297017704865509 | 0.45819277171637834 | 0.26416169623741237 | 0.24022845026183584 | 0.21376575735540573 | 0.18929103849637752 | 0.20381573166587716 | 0.21086610220048516 | ... | 0.0 | 0.0 | 0.0 | 0.0 | 0.0 | 0.0 | 0.0 | 0.0 | 0.0 | 0.0 |
| 99999 | 0.9259994004527861 | 0.916476635326053 | 0.4042900774399834 | 0.0 | 0.2630344094167657 | 0.3854310437765884 | 0.3610665021846972 | 0.33270794046870034 | 0.33985000288462475 | 0.3504972538285509 | ... | 0.0 | 0.0 | 0.0 | 0.0 | 0.0 | 0.0 | 0.0 | 0.0 | 0.0 | 0.0 |
100000 rows × 205 columns
type(x)
pandas.core.frame.DataFrame
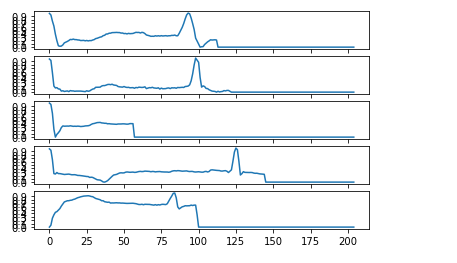
绘制5个的心电图的plot图 (train)
from matplotlib import pyplot as plt
import numpy as np
import sys


for i in range(0, 5):
    plt.figure(12)
    val = [float(x) for x in np.array( x.iloc[i,:])]
    plt.subplot(5,1,i+1)
    my_y_ticks = np.arange(-1.0, 1.0, 0.1)
    plt.yticks(my_y_ticks)
    plt.plot(val)

plt.show()
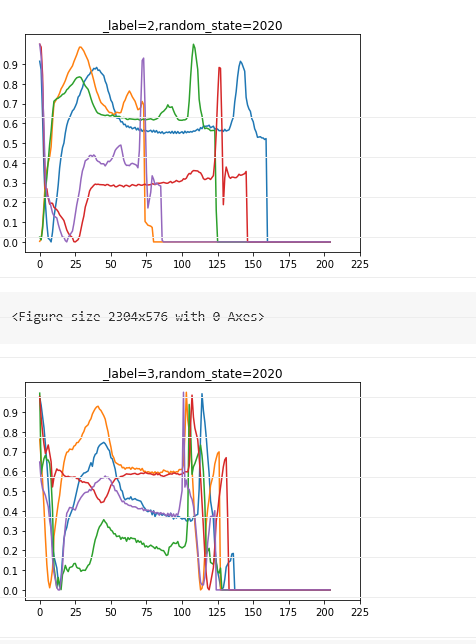
绘制label为0-3的分别的5个plot重叠图 (train)
print('')
for _label in range(0,4):
    for random_state in [2020]:
        spl = train[train['label']==_label].sample(n=5, random_state=random_state)
        sample = x[x.index.isin(spl.index)]
        for i in range(spl.shape[0]):
            float_val =[float(x) for x in np.array(sample.iloc[i, :])]
            plt.plot(float_val)

        plt.title("_label=" + str(_label)+",random_state="+str(random_state))
        plt.yticks(np.arange(0, 1.0, 0.1))
        plt.xticks(np.arange(0, 250, 25))
        plt.figure(figsize=(32, 8))
        plt.show()