delivery_analyze.csv文件中提供了4个输入数据,一个标签数据;

  1 49.986721,50,48.862217,49,34
  2 23.480339,63,22.087894,23,45
  3 47.97068,121,38.859943,44,74
  4 61.894985,117,48.692921,56,90
  5 52.253571,61,49.11853,55,73
  6 19.852621,74,19.222271,72,72
  7 20.845728,62,19.947214,57,56
  8 44.538506,115,37.98954,43,43
  9 13.515056,31,12.830379,28,55
 10 23.994682,69,21.488462,59,85
 11 35.872845,79,32.430157,33,44
 12 29.536407,72,28.510805,64,90
 13 45.398739,128,39.323338,40,35
 14 29.679146,34,27.898521,31,62
 15 84.080841,87,77.693764,74,73
 16 46.169239,134,42.523769,47,38
 17 39.475365,93,34.886265,49,49
 18 59.247337,60,57.82312,58,16
 19 30.091749,92,26.634928,67,68
 20 21.239315,64,20.726948,61,61
 21 32.904915,124,30.729103,34,15
 22 70.833916,64,68.500946,61,54
 23 42.092319,97,38.191372,71,71
 24 16.85672,21,16.744583,21,35
 25 39.519398,99,31.689426,43,52
 26 19.60574,30,17.920612,25,46
 27 30.031826,92,26.656433,67,67
 28 26.915159,33,24.503157,28,20
 29 21.294516,82,19.798532,74,74
 30 39.678482,121,34.299995,47,38
 31 69.679398,68,66.585281,64,35
 32 33.415878,99,27.269951,29,42
 33 37.286701,121,27.919937,34,68
 34 22.043592,51,21.266073,48,48
 35 48.50737,133,37.857922,44,46
 36 34.138905,75,34.10067,74,74
 37 37.146286,56,32.108444,43,50
 38 30.016088,51,28.376884,34,34
 39 36.044006,80,30.333361,50,38
 40 71.459511,122,55.584164,58,45
 41 22.01244,84,20.370054,74,74
 42 53.094749,135,40.457184,46,56
 43 36.035366,110,30.367359,39,45
 44 35.164429,74,35.164429,74,74
 45 31.496492,34,30.231068,32,55
 46 34.097385,36,32.628937,33,50
 47 26.203951,28,25.222651,26,16
 48 52.870003,57,48.843529,52,110
 49 71.513496,123,55.356491,58,48
 50 34.929268,107,29.545202,39,50
 51 20.235893,62,19.217731,27,60
 52 23.946028,58,23.30785,35,40
 53 19.356678,58,18.866066,54,54
 54 35.159679,41,35.159081,41,69
 55 38.879154,131,31.500521,37,37
 56 34.023487,82,32.900944,77,77
 57 30.402153,71,28.825174,66,66
 58 36.666336,100,33.766953,37,81
 59 31.849125,96,27.252998,35,57
 60 14.701057,66,13.695985,59,58
 61 24.746655,37,22.891354,30,35
 62 15.988938,57,15.686599,55,56
 63 64.210938,124,49.422485,53,58
 64 38.794212,113,33.314041,39,74
 65 13.345396,57,13.345396,57,56
 66 41.711437,124,31.613926,37,110
 67 38.293716,79,37.682972,76,76
 68 28.073799,75,24.945026,34,46
 69 24.975405,38,22.897106,29,40
 70 36.917492,116,29.782568,39,56
 71 56.393402,69,56.080254,68,44
 72 49.489582,71,46.603695,64,26
 73 11.233971,51,10.257475,26,45
 74 75.045959,82,69.606705,72,72
 75 57.210033,65,55.995747,62,46
 76 47.267517,117,36.350822,44,95
 77 13.978129,62,13.61613,59,58
 78 19.296797,54,19.054842,53,53
 79 13.23297,60,13.115759,59,58
 80 37.072403,116,30.066593,40,55
 81 22.710648,37,21.312677,34,34
 82 77.6241,76,73.901886,71,35
 83 68.972183,80,59.639511,65,115
 84 14.73587,64,14.347698,62,62
 85 27.683052,82,26.073189,73,14
 86 8.845615,23,8.736045,22,40
 87 50.006321,120,38.885624,48,45
 88 61.246403,67,59.450649,63,72
 89 27.532454,88,24.988146,74,74
 90 46.767673,115,36.288193,46,105
 91 59.823963,66,58.650486,64,25
 92 38.470818,117,31.213203,41,60
 93 53.724159,108,46.329811,48,55
 94 13.401003,61,13.132825,60,58
 95 46.456448,126,38.748985,43,43
 96 82.047318,78,78.135925,73,50
 97 34.080803,94,28.746769,40,65
 98 26.933811,79,25.688793,75,75
 99 30.923611,66,29.268738,38,60
100 34.891171,36,33.256649,34,40
注:输入数据依次的含义:
原灰度图像均值: src_mean;
原灰度图像的全局分割Otsu阈值:src_otsu;
原灰度图的强光像素(>220)被图像修复之后的灰度图的均值:src_inpait_mean;
原灰度图的强光像素(>220)被图像修复之后的灰度图的全局分割Otsu阈值:src_inpait_otsu;
标签数据是针对图像修复之后的灰度图,通过图像专家软件,人工操作定位面单区域的最佳分割阈值:src_threshold_val;
目的是根据样本数据的四个特征值,及标签数据,拟合一个回归模型,实现预测定位面单的最佳分割阈值。
1. 线性回归模型
四元一次线性回归模型

 1 import numpy as np
 2 from numpy import genfromtxt
 3 from sklearn import linear_model
 4
 5 dataPath = r"delivery_analyze.csv"
 6 deliveryData = genfromtxt(dataPath, delimiter=',')
 7
 8 print("data")
 9 print(deliveryData)
10
11 X = deliveryData[:, :-1]
12 Y = deliveryData[:, -1]
13
14 print("X:")
15 print(X)
16 print("Y: ")
17 print(Y)
18
19
20 regr = linear_model.LinearRegression()
21
22 regr.fit(X, Y)
23
24 print("coefficients")
25 print(regr.coef_)
26 print("intercept: ")
27 print(regr.intercept_)
28
29 xPred = [41.711437,    124, 31.613926,    37]
30 yPred = regr.predict(np.array(xPred).reshape(1, -1))
31 print("predicted y: ")
32 print(yPred)
注: 四元:是指输入的变量个数是4个(如x1, x2, x3, x4);
一次:是指输入变量的最高次幂是1,(如x);
线性回归:是指输入变量与输出变量存在线性关系,如y =k*x+b;
非线性回归:是指输入变量与输出变量存在非线性关系,是指除线性关系外的其他关系形式,如:曲线形式、神经网络的表达形式等;
2. 非线性回归模型
多元多次非线性回归模型(重点指:曲线高次幂的关系形式)
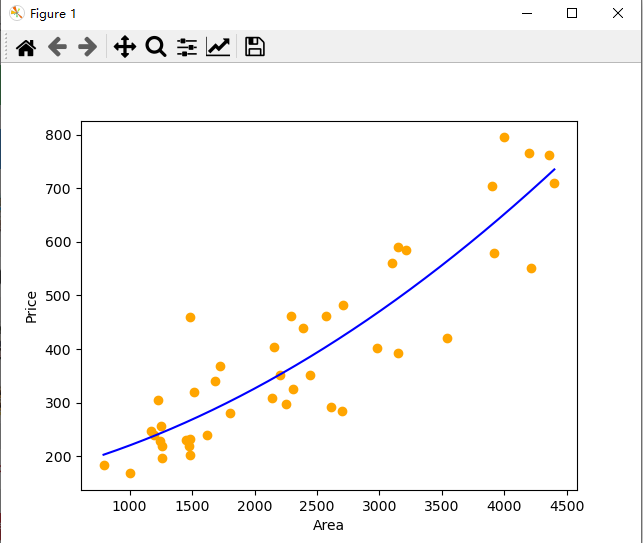
price.txt 和 Multi_LR.py

 1 1000,168
 2 792,184
 3 1260,197
 4 1262,220
 5 1240,228
 6 1170,248
 7 1230,305
 8 1255,256
 9 1194,240
10 1450,230
11 1481,202
12 1475,220
13 1482,232
14 1484,460
15 1512,320
16 1680,340
17 1620,240
18 1720,368
19 1800,280
20 4400,710
21 4212,552
22 3920,580
23 3212,585
24 3151,590
25 3100,560
26 2700,285
27 2612,292
28 2705,482
29 2570,462
30 2442,352
31 2387,440
32 2292,462
33 2308,325
34 2252,298
35 2202,352
36 2157,403
37 2140,308
38 4000,795
39 4200,765
40 3900,705
41 3544,420
42 2980,402
43 4355,762
44 3150,392

 1 import matplotlib.pyplot as plt
 2 import numpy as np
 3 from sklearn import linear_model
 4 from sklearn.preprocessing import PolynomialFeatures
 5
 6 # 读取数据集
 7 datasets_X = [] #建立datasets_X储存房屋尺寸数据
 8 datasets_Y = [] #建立datasets_Y储存房屋成交价格数据
 9 fr = open('price.txt', 'r', encoding='utf-8') #指定prices.txt数据集所在路径
10
11 lines = fr.readlines() #读取一整个文件夹
12 for line in lines: #逐行读取,循环遍历所有数据
13     items = line.strip().split(",") #变量之间按逗号进行分隔
14     datasets_X.append(int(items[0])) #读取的数据转换为int型
15     datasets_Y.append(int(items[1]))
16
17
18 # 数据预处理
19 length = len(datasets_X)
20 datasets_X = np.array(datasets_X).reshape([length, 1]) #将datasets_X转化为数组
21 datasets_Y = np.array(datasets_Y)
22 print(datasets_X.shape)
23 print(datasets_Y.shape)
24
25 minX = min(datasets_X) #以数据datasets_X的最大值和最小值为范围,建立等差数列,方便后续画图
26 maxX = max(datasets_X)
27 X = np.arange(minX, maxX).reshape([-1, 1])
28
29 # 数据建模
30 poly_reg = PolynomialFeatures(degree=2) #degree=2表示二次多项式
31 X_poly = poly_reg.fit_transform(datasets_X) #构造datasets_X二次多项式特征X_poly
32 lin_reg_2 = linear_model.LinearRegression() #创建线性回归模型
33 lin_reg_2.fit(X_poly, datasets_Y) #使用线性回归模型学习X_poly和datasets_Y之间的映射关系
34
35 # 查看回归系数
36 print('Coefficients:', lin_reg_2.coef_)
37 # 查看截距项
38 print('intercept:', lin_reg_2.intercept_)
39
40 # 数据可视化
41 plt.scatter(datasets_X, datasets_Y, color='orange')
42 plt.plot(X, lin_reg_2.predict(poly_reg.fit_transform(X)), color='blue')
43 plt.xlabel('Area')
44 plt.ylabel('Price')
45
46 plt.show()
47
48
49 # 相关系数Coefficients: [  0.00000000e+00   4.93982848e-02   1.89186822e-05]
50 # 截距项intercept: 151.846967505
51 # 非线性回归公式:Y = 151.8470 + 4.9398e-02*x + 1.8919e-05*x^2

3.多元非线性回归模型

 1 import matplotlib.pyplot as plt
 2 import numpy as np
 3 from numpy import genfromtxt
 4 from sklearn import linear_model
 5 from sklearn.preprocessing import PolynomialFeatures
 6
 7 dataPath = r"delivery_analyze.csv"
 8 deliveryData = genfromtxt(dataPath, delimiter=',')
 9
10 print("data")
11 print(deliveryData)
12
13 X = deliveryData[:, :-1]
14 Y = deliveryData[:, -1]
15
16 # print("X:")
17 # print(X)
18 # print("Y: ")
19 # print(Y.shape)
20
21 poly_reg = PolynomialFeatures(degree=7) #degree=2表示二次多项式
22 X_poly = poly_reg.fit_transform(X)
23 lin_reg_2 = linear_model.LinearRegression()
24 lin_reg_2.fit(X_poly, Y)
25
26
27 # 查看回归系数
28 print('Coefficients:', lin_reg_2.coef_)
29 # 查看截距项
30 print('intercept:', lin_reg_2.intercept_)
31
32 X_pred =  [42.785381,    106,    36.288177,    47]
33
34 X_pred = np.array(X_pred).reshape(1, -1)
35 Y_pred = lin_reg_2.predict(poly_reg.fit_transform(X_pred))
36
37 print(Y_pred)
38
39 # plt.scatter(X, Y, color='orange')
40 # plt.show()
